OpenLM Actual Usage
A significant challenge when monitoring the utilization of network licenses is to find out whether and how the specific software is being used, and for which license is being utilized. OpenLM delivers two figures to be able to measure this factor:
- Duration of time a license is consumed by a specific user a session
- Duration of time a shared license application was actually in use and for how long a period.
Before viewing, there are several steps needed to follow that will make it possible to assess Actual Usage:
-
Make sure the OpenLM Workstation Agent is installed on the end user's workstation.
-
Open the EasyAdmin user interface.
-
Click Start → Administration→ Process Features
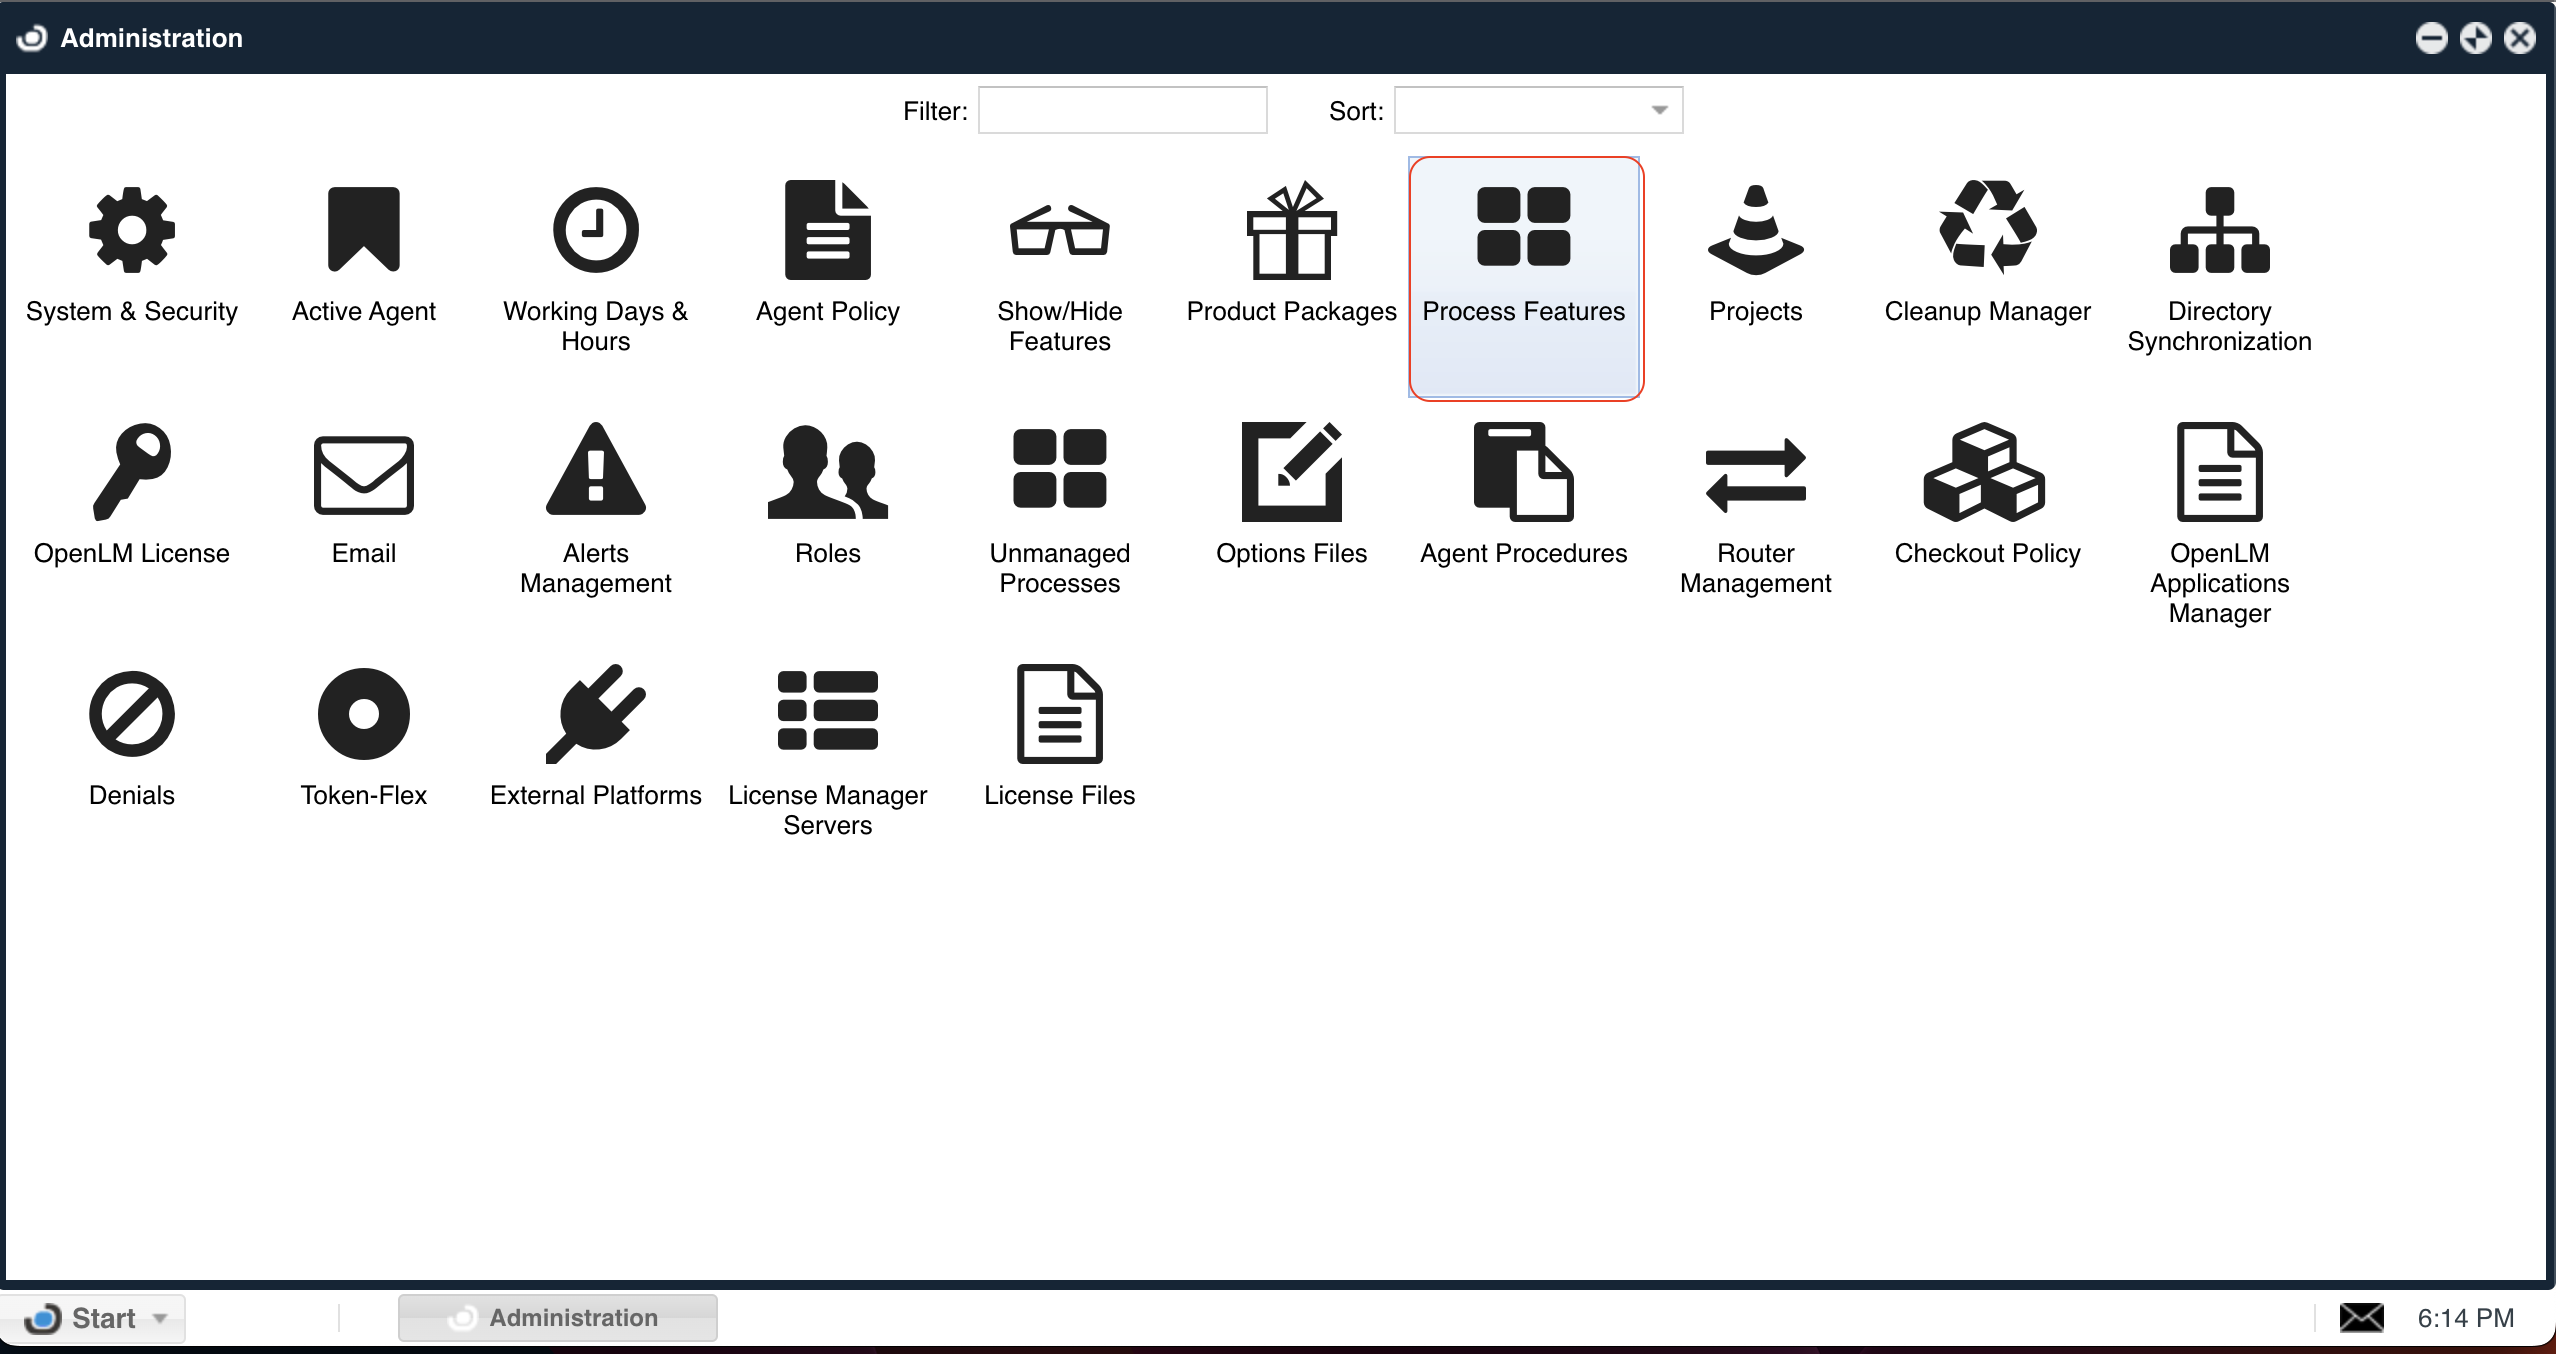
- The Process features window will open:

- If the process that needs monitoring is not already on the list of processes, it needs to be added manually:
a. Go to Administration → Process Features → Add:
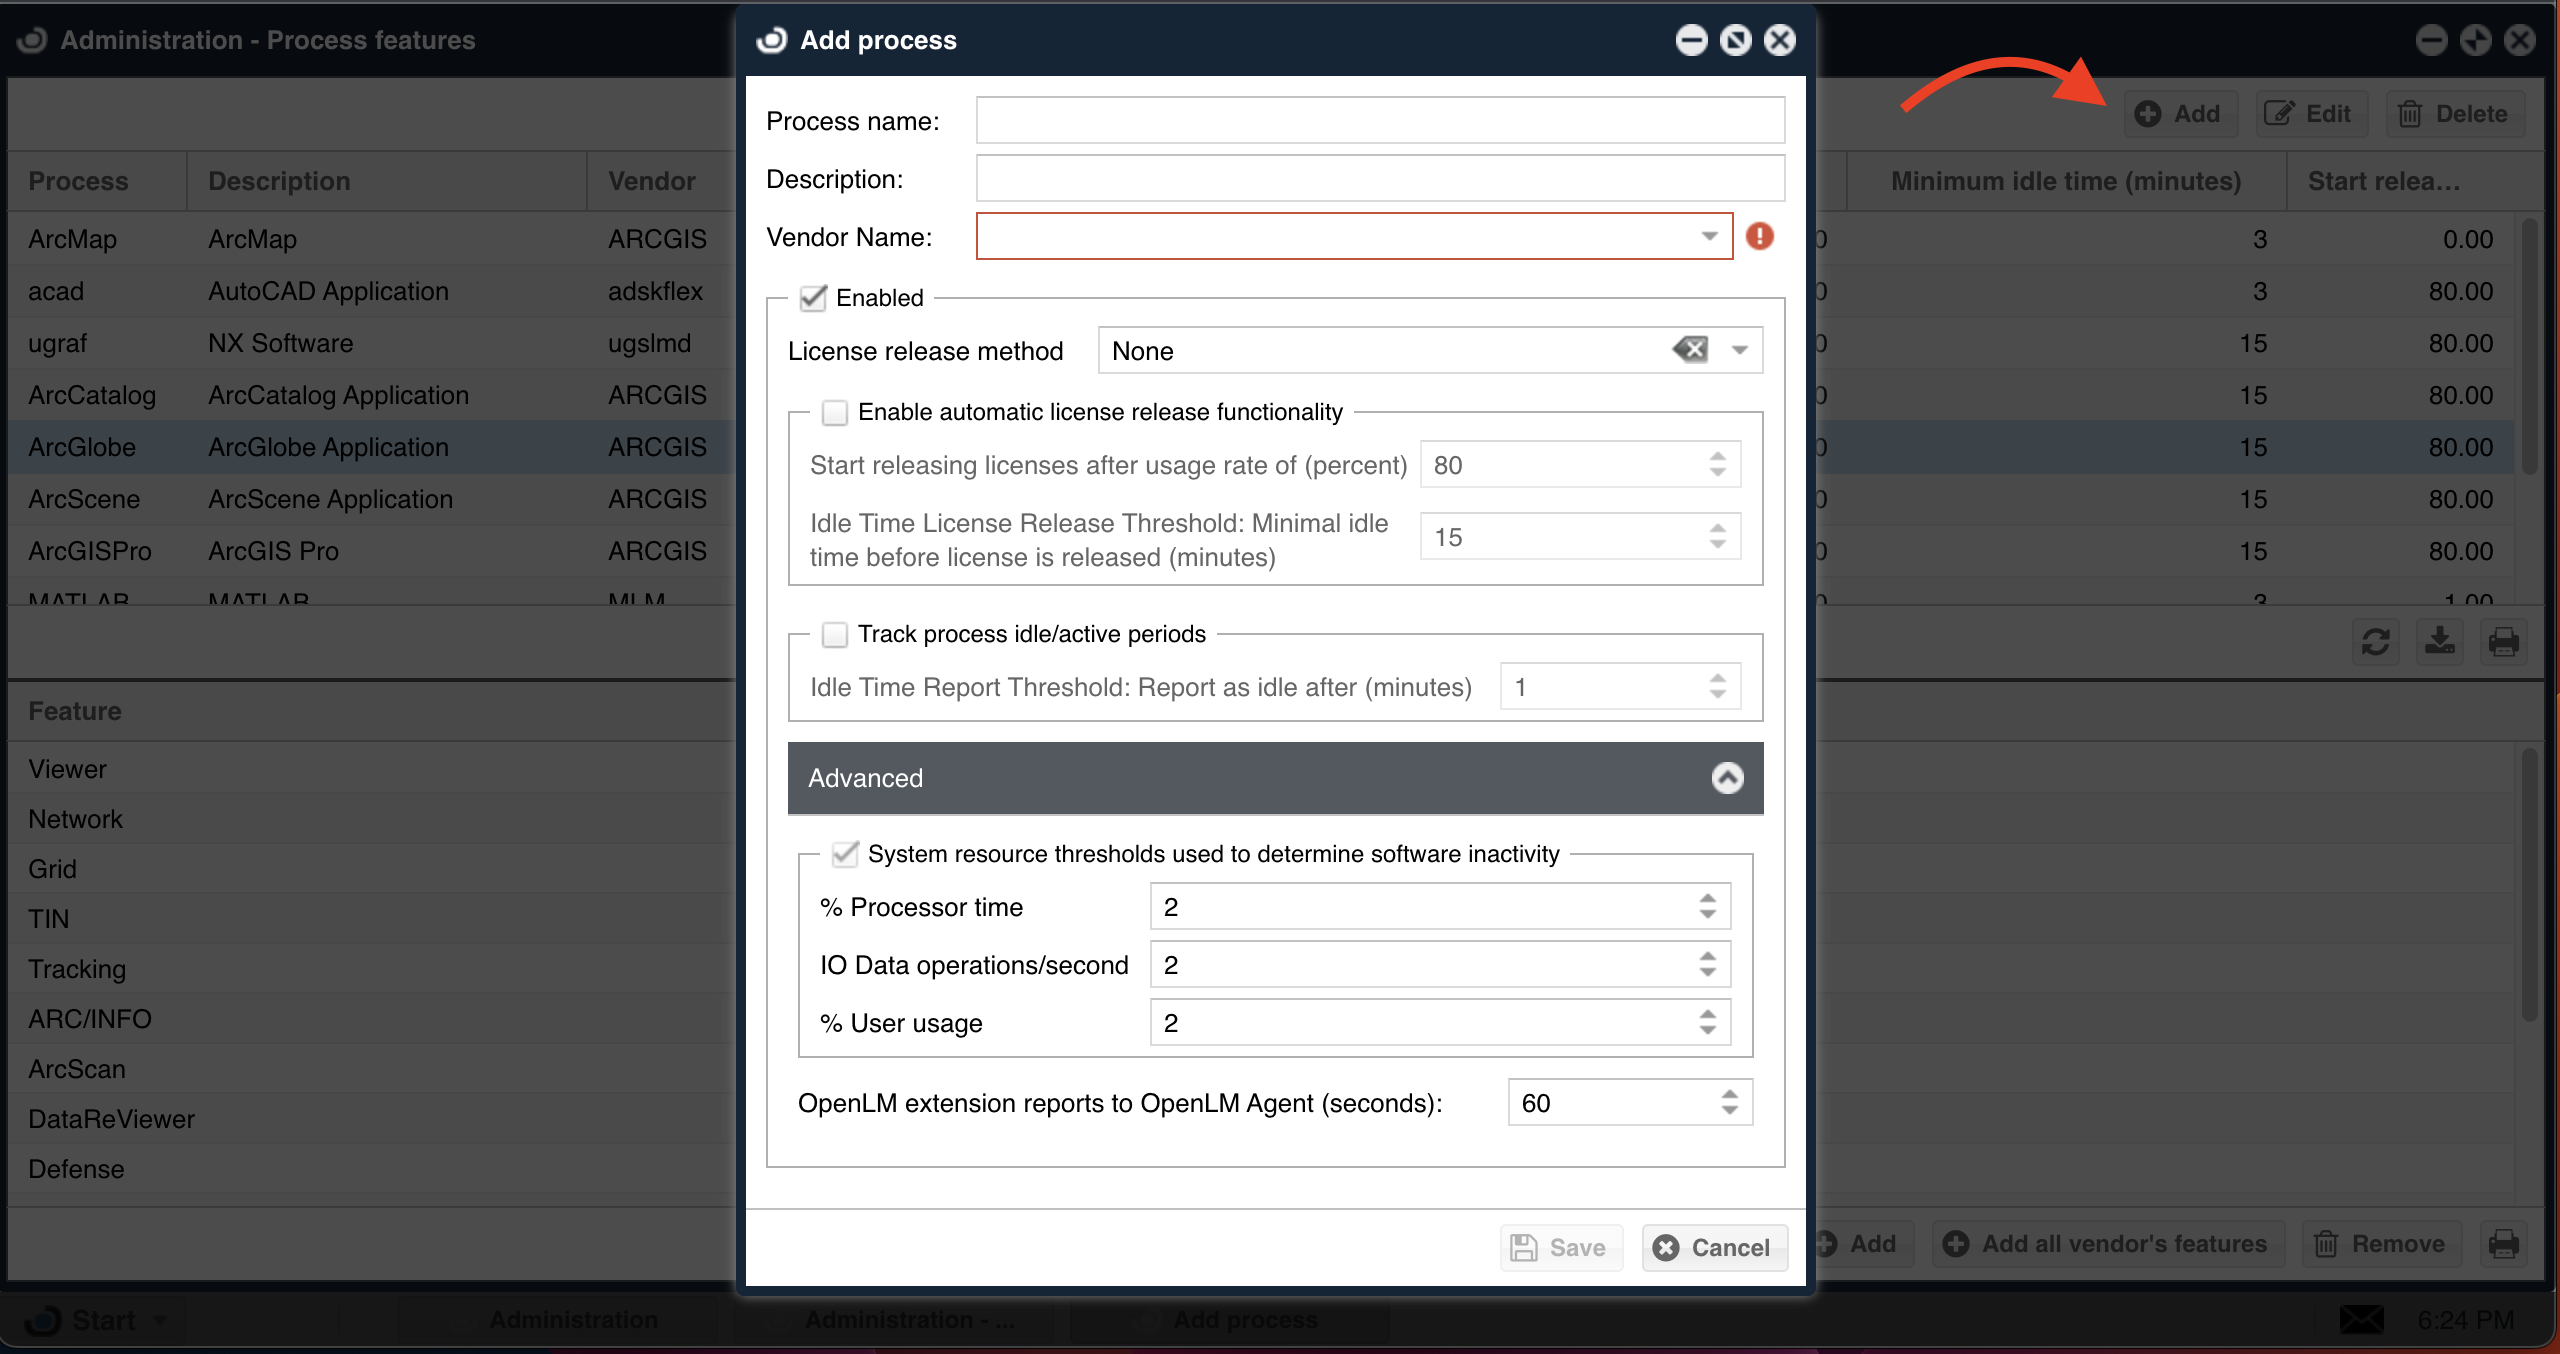
- Configure the process window to monitor idle licenses:
- Provide a Process name, e.g: ArcMap.
- Provide a Description of the managed process, and
- Provide the application's Vendor name exactly as appears in the license file.
- Very important that the Enabled, Save process activity, and System resource threshold used boxes are marked.
- Set the Idle Time Report Threshold. This is the minimum period of time before an inactive session is reported as idle.
- Set the software resource thresholds. These numbers indicate the thresholds under which a process is considered idle.
After completing the process described above in paragraphs 1 through 6, the Active Agent is set to monitor the managed process.
Tracking Actual Usage
-
Open the OpenLM EasyAdmin web application.
-
Click Start → Operational → Currently Consumed Licenses. The Currently Consumed Licenses page is open.
-
Click the Crescent moon icon (
) for a particular row to view the Actual usage of a particular vendor.
This window lists all currently active sessions. Using this window, administrators can monitor individual workstations that run licensed applications.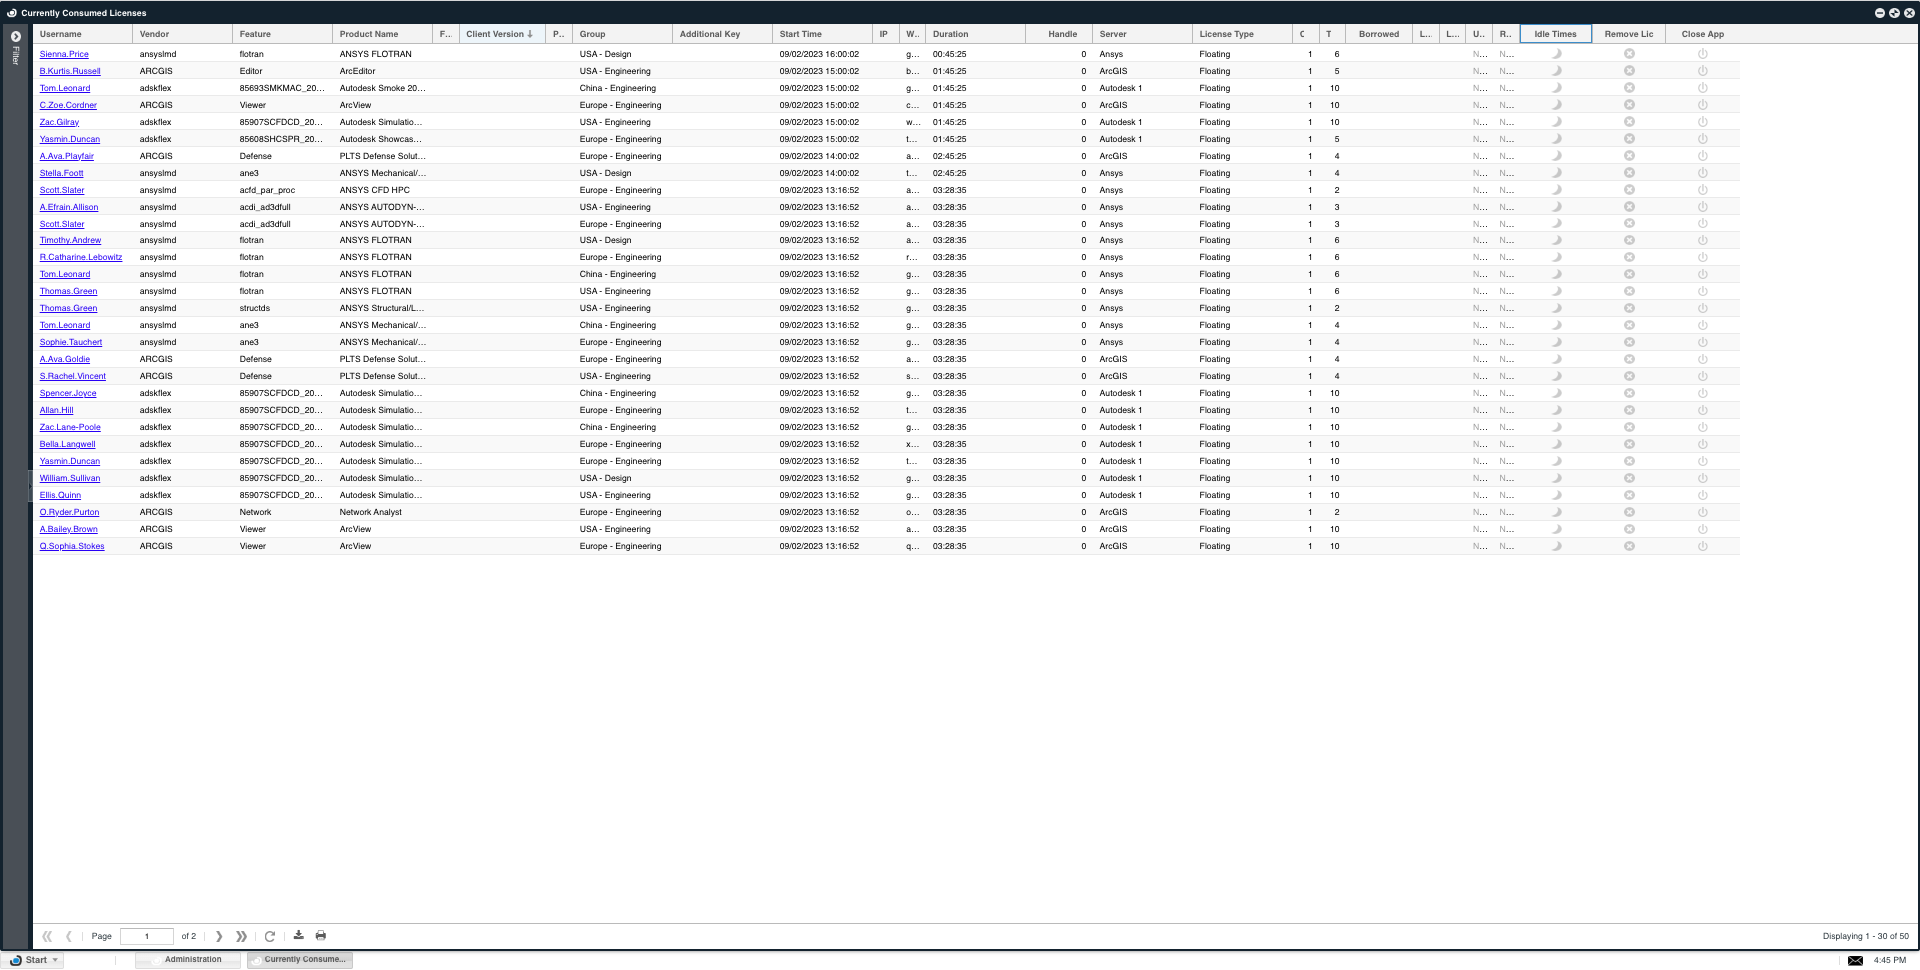
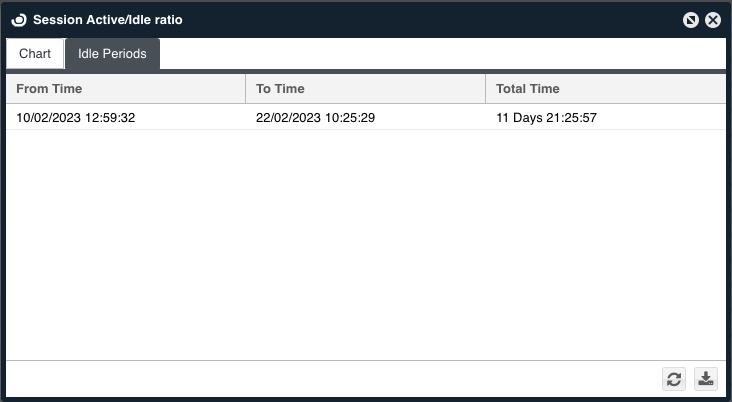
- The peaks in the chart represent Active Usage which represents the Actual Usage. The low flat line represents the Idle time.
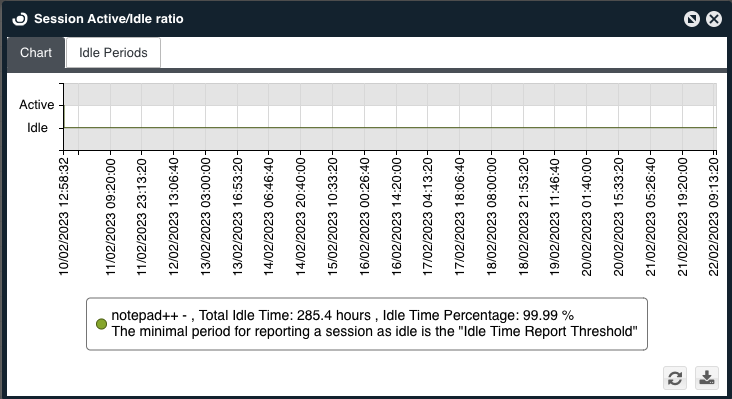
It is also able to differentiate the exact Actual Usage from the Idle time.
