Decide whether to purchase subscription licenses or to renew license maintenance
The License Utilization chart is a powerful tool for assessing the efficiency of license utilization in the organization. This is especially important for customers who are contemplating the purchase or renewal of a subscription license (e.g. Autodesk subscription licenses) or renewing license maintenance. Below see how to determining license utilization efficiency.
Where is it?
To view the license utilization of a specific feature or group of features:
- Click the EasyAdmin User Interface ‘Start’ → ‘Management’ → “License Utilization” menu item.
- Fill in the filter data (e.g. Feature name, Server name, etc)
- Select the date range. Note that long date ranges provide improved statistical utilization data
- Select whether to consider weekends and off-hours data, and
- Click ‘Apply’
Available data
The emitted report encompasses data regarding:
- Aggregated usage presentation: A clear license utilization cut-off indicator
- Quality of Service (QoS): License efficiency indicator
- Detection of abnormal usage patterns: Where did these licenses go?
Some technical background is required here to explain the aforementioned bullets:
Presentation option 1: Show Aggregated
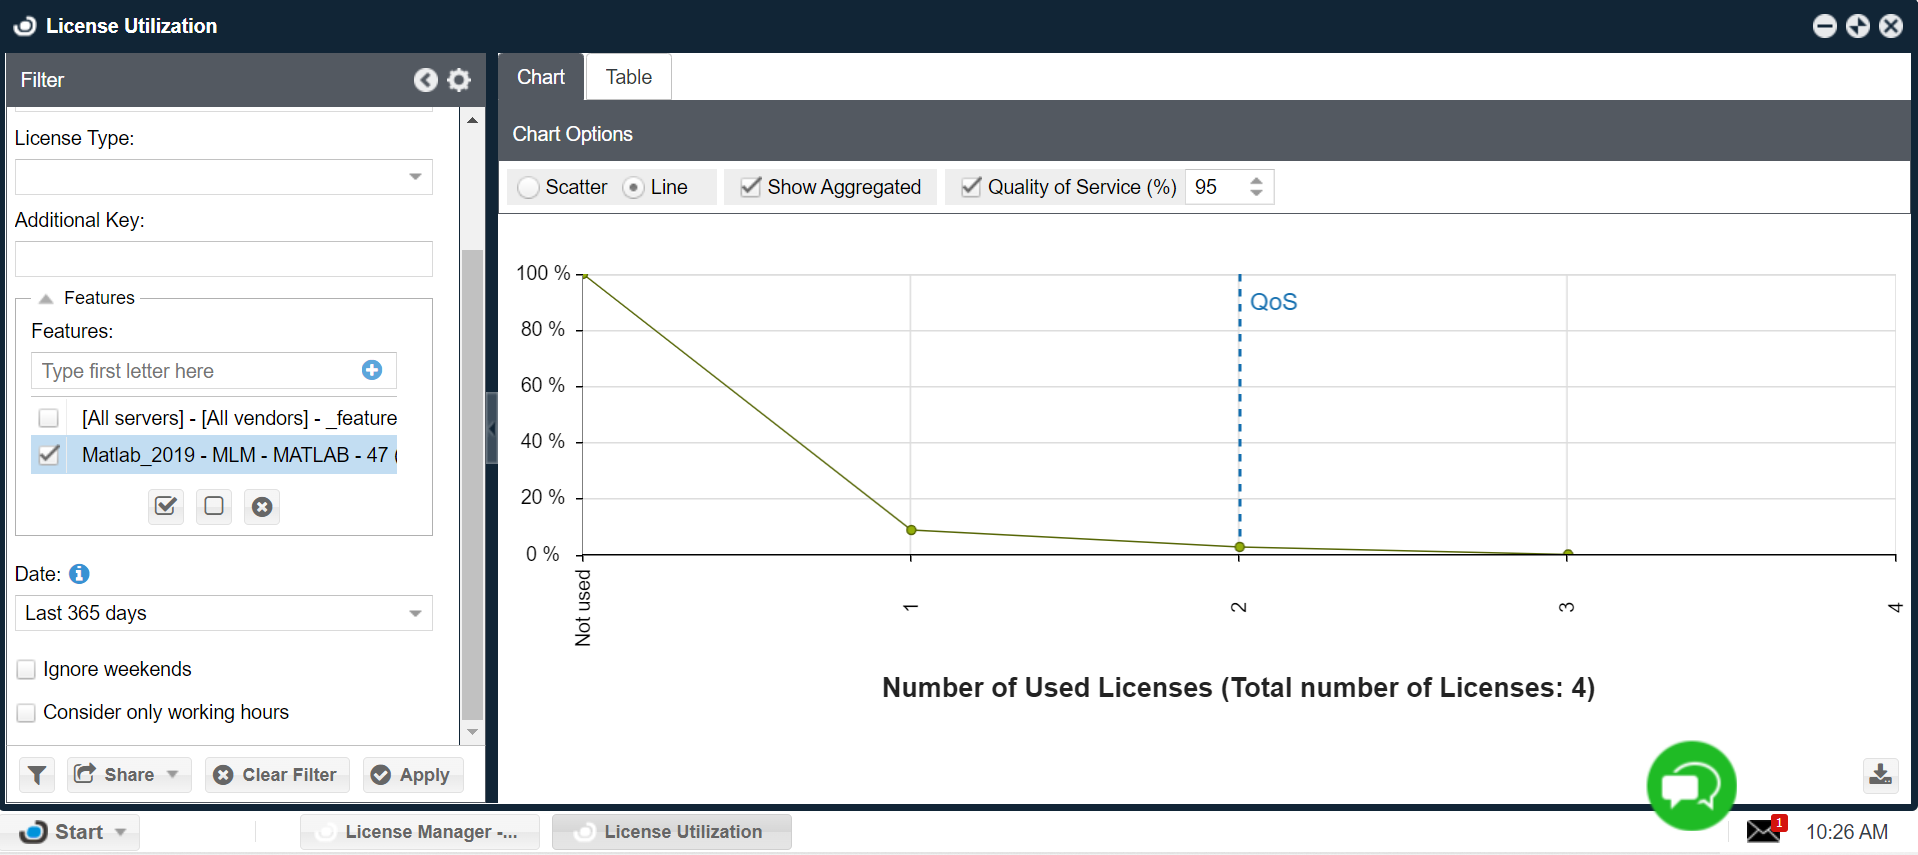
If the “Show aggregated” box is checked, the chart will present the aggregated percentage of usage, i.e. each point (x,y) answers the question: “What is the percentage of usage time (y) that AT LEAST a given number of licenses (x) have been in contemporary use?”.
Referring to the example below, for a total number of 4 licenses:
- At least 0 licenses have been in contemporary use 100 % of the time.
- At least 1 license has been in contemporary use 8.73 % of the time
- At least 2 licenses have been in contemporary use 2.7 % of the time
- At least 3 licenses have been in contemporary use 0.01 % of the time

Figure 1: Aggregated usage
This form of presentation filters out temporary usage peaks and provides insight into the actual number of licenses required to support the current level of activity.
Presentation option 2: No aggregation
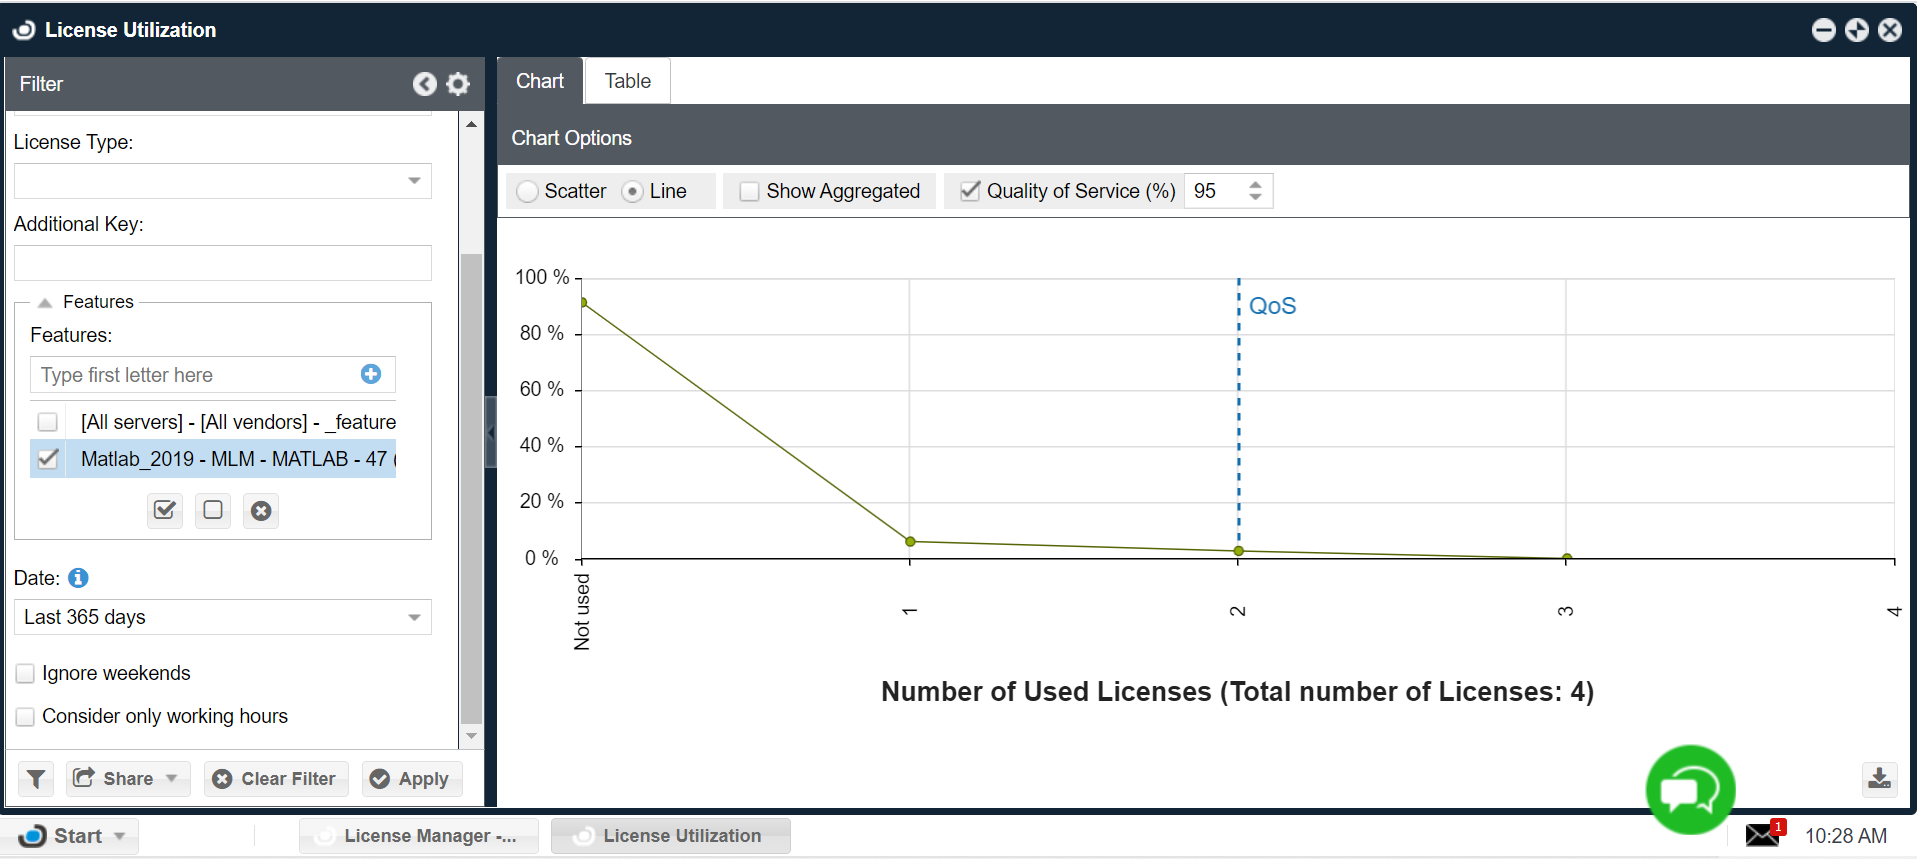
If the “Show aggregated” box is NOT checked, the utilization chart will present a histogram of license usage. That means, about the x & y chart axes, that each point (x,y) answers the question: “What is the percentage of usage time (y) that an EXACT number of licenses (x) have been in use at the same time?”.
Referring to the example depicted below:
- Exactly 0 licenses have been in contemporary use 91.27% of the time.
- Exactly 1 license has been in use 6.03% of the time
- Exactly 2 licenses have been in contemporary use 2.69% of the time
- Exactly 3 licenses have been in contemporary use 0.01% of the time …
Note that this algorithm produces a non-monotonous function (e.g. the value for 3 contemporary licenses is higher than the value for 2 contemporary licenses).

Figure 2: Non-aggregated usage
Extracting license efficiency information
As mentioned above, the emitted report encompasses data regarding:
Aggregated usage presentation: clear license utilization cut-off
The aggregated presentation is of decreasing function, which presents the number of required licenses. About the example presented in figure 1, there have never been 4 licenses in contemporary use within the past 365 days.
Quality of Service (QoS): license efficiency indicator
The Quality of Service (QoS) parameter is the percentage of configurable required license availability, as defined by the license administrator.
Consider the example presented in figure 1:
To support 95% of license requests, the organization would only need 2 licenses. Having procured 4 licenses means that the organization owns 2 redundant licenses.
This information is crucial when considering license subscription renewal, additional license procurement, or license maintenance renewal.
Detection of abnormal usage patterns:
By comparing the two formats presented in figures 1 & 2 (w/wo the “Show Aggregated” check box), one could notice ‘blips’ in the utilization chart (e.g. for the value of 3 licenses). These ‘blips’ may indicate abnormal usage patterns, such as long-forgotten active sessions, or offline (‘borrowed’) licenses.

