Historical license usage reports
OpenLM monitors license data in real time and accumulates it in a relational database. This approach facilitates both:
- Management of network licenses in real-time, and
- Production of historical license usage reports.
This document is a short overview of the historical license reports available on the OpenLM EasyAdmin User Interface.
For a more overall view of the different capabilities offered by EasyAdmin, please refer to this document.
License usage
Click the EasyAdmin 'Start' → 'Reports' → "License Usage".
The powerful license usage report window counts for the consumption of single or multiple feature licenses concerning the total number of licenses. It presents license consumption patterns over configurable periods and sample resolutions. This information can be used to identify bottlenecks and redundancies in the license inventory.
This report is available in 3 different formats, according to the tabs in the display pane: As a table, a chart, or as a heatmap diagram.
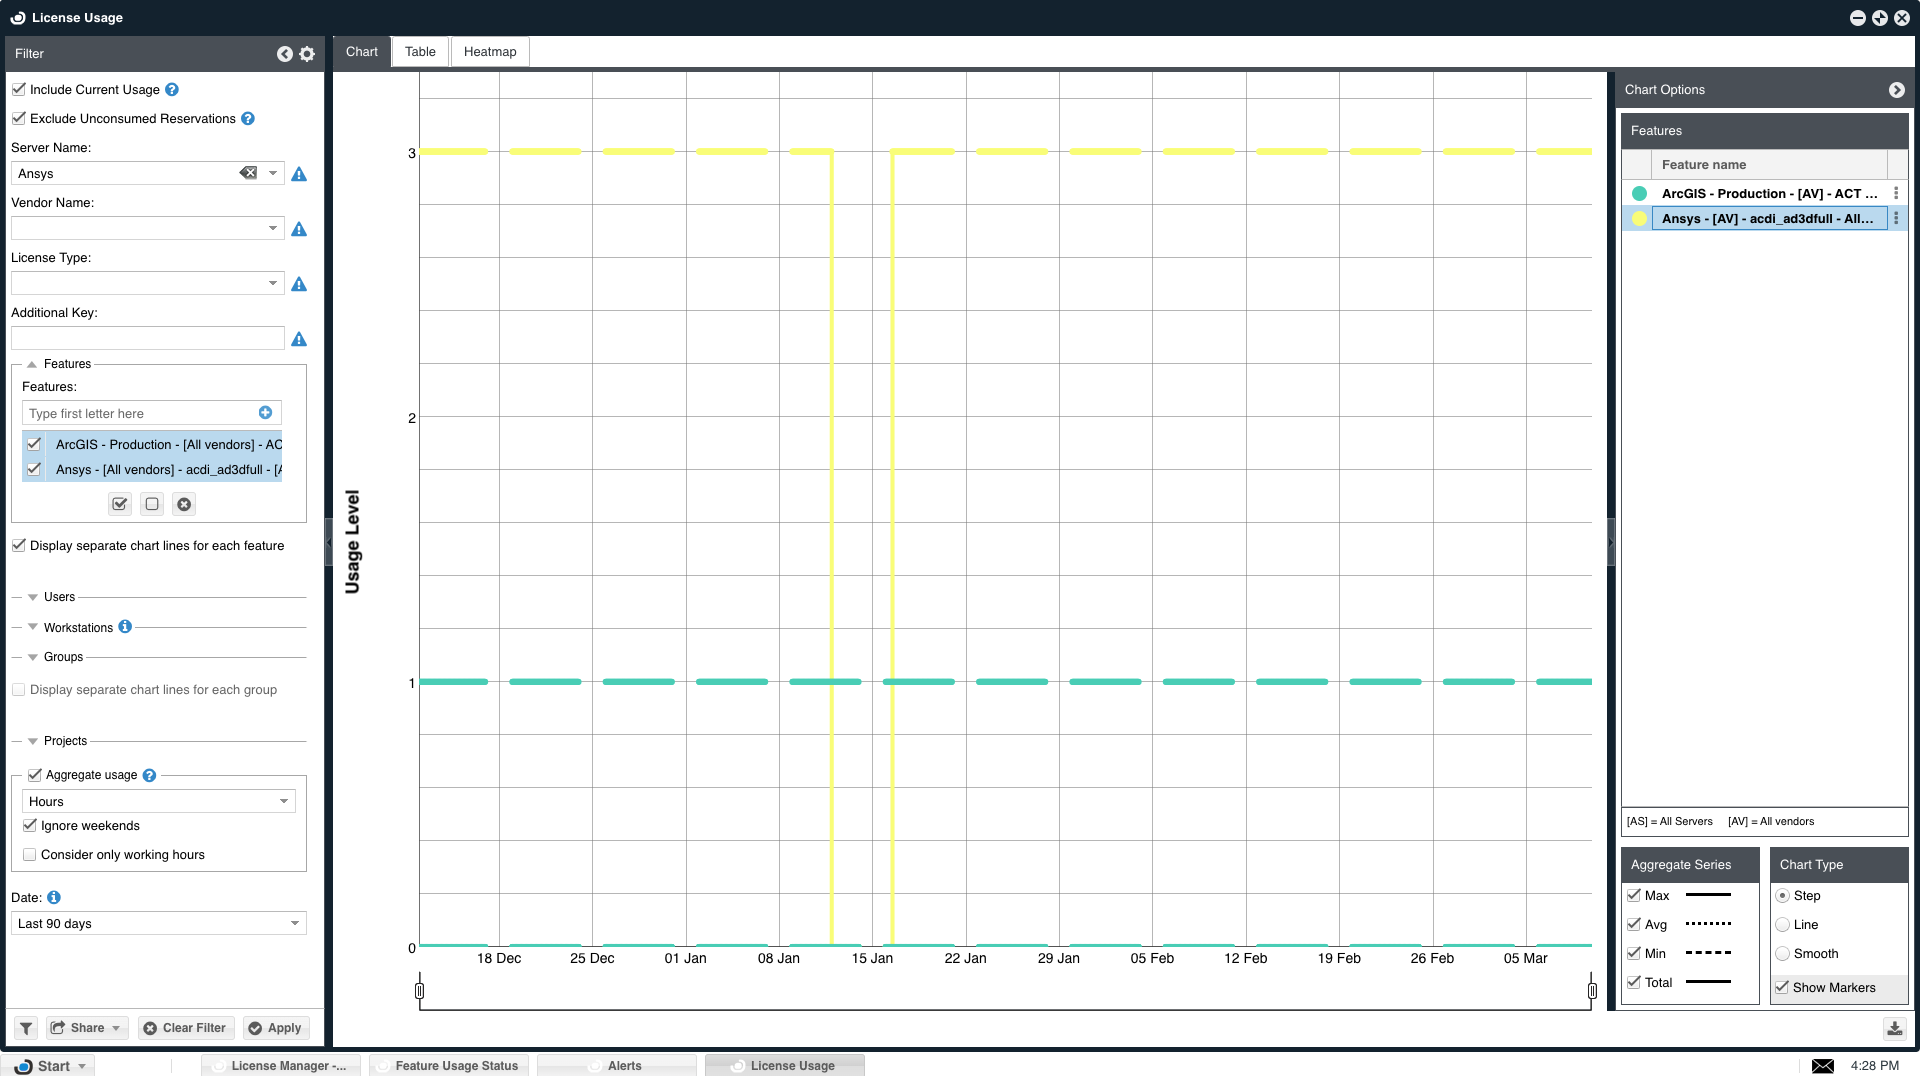
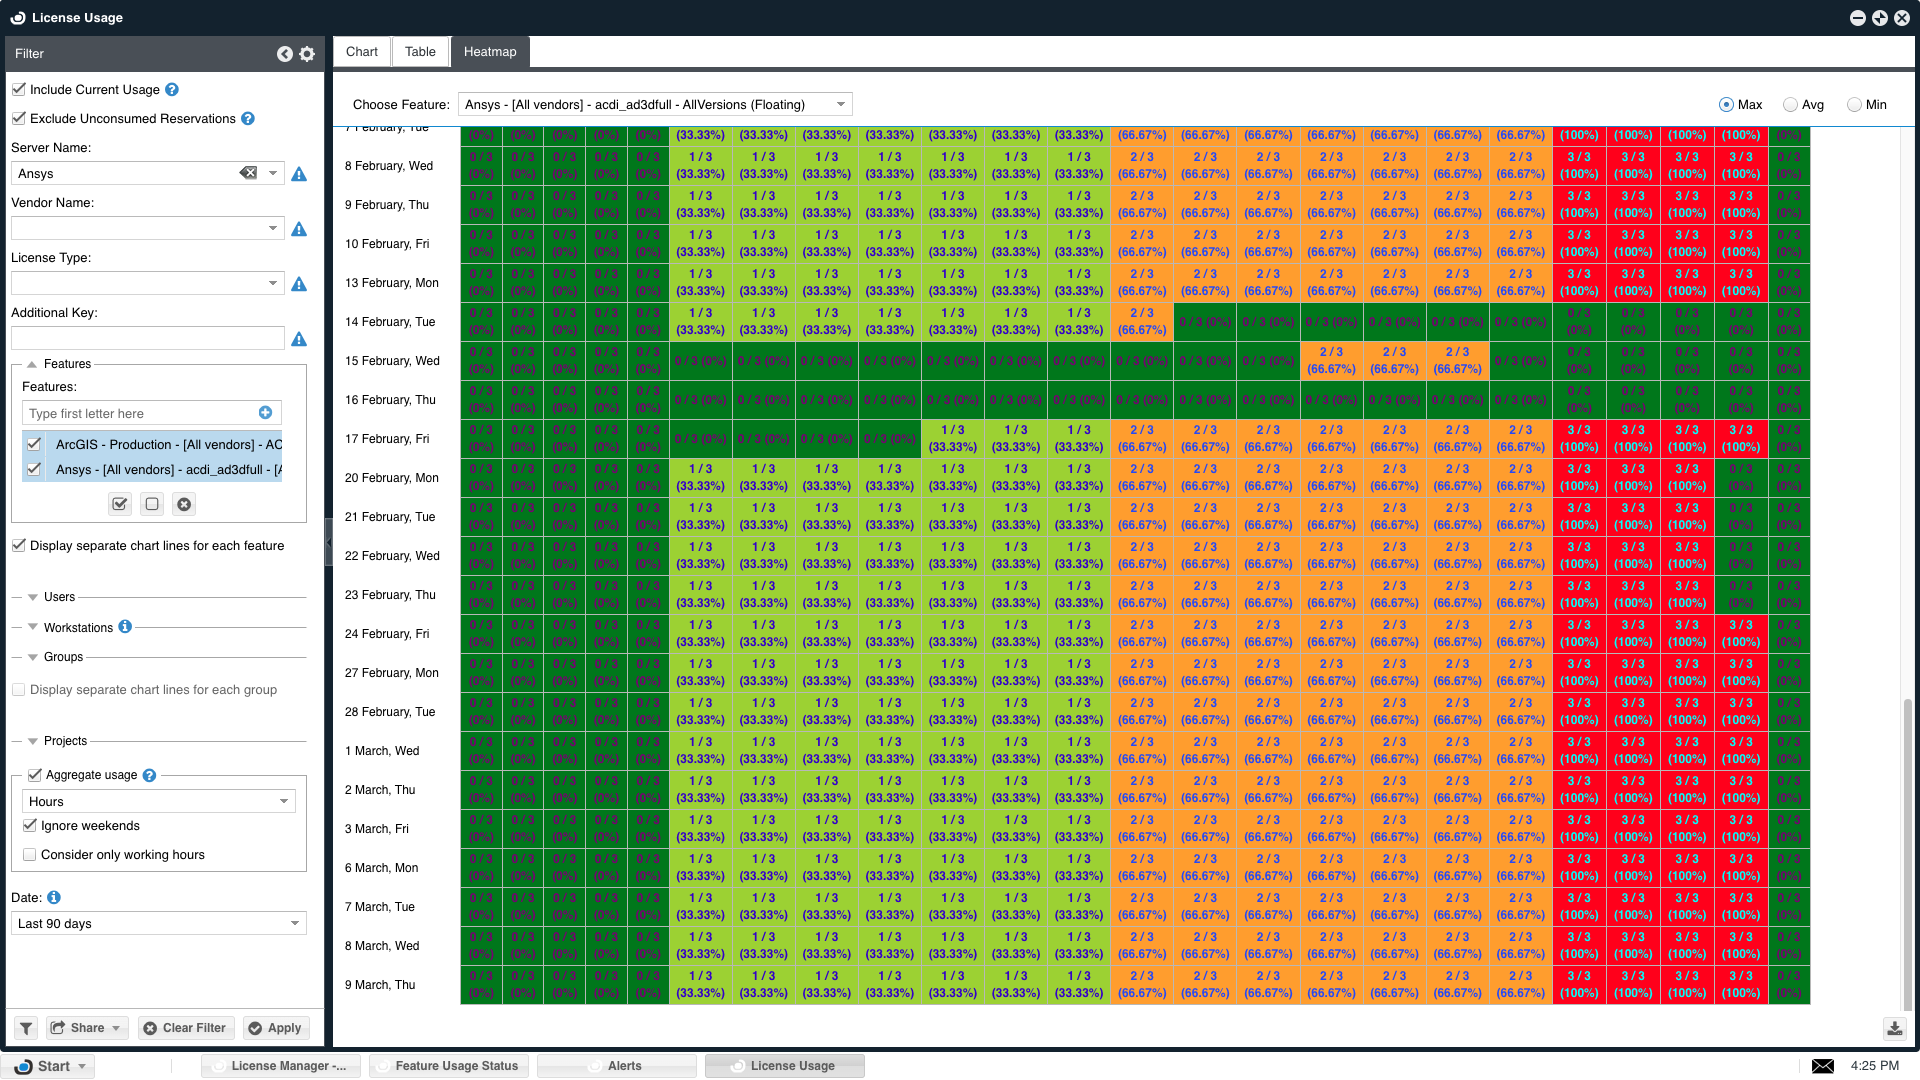
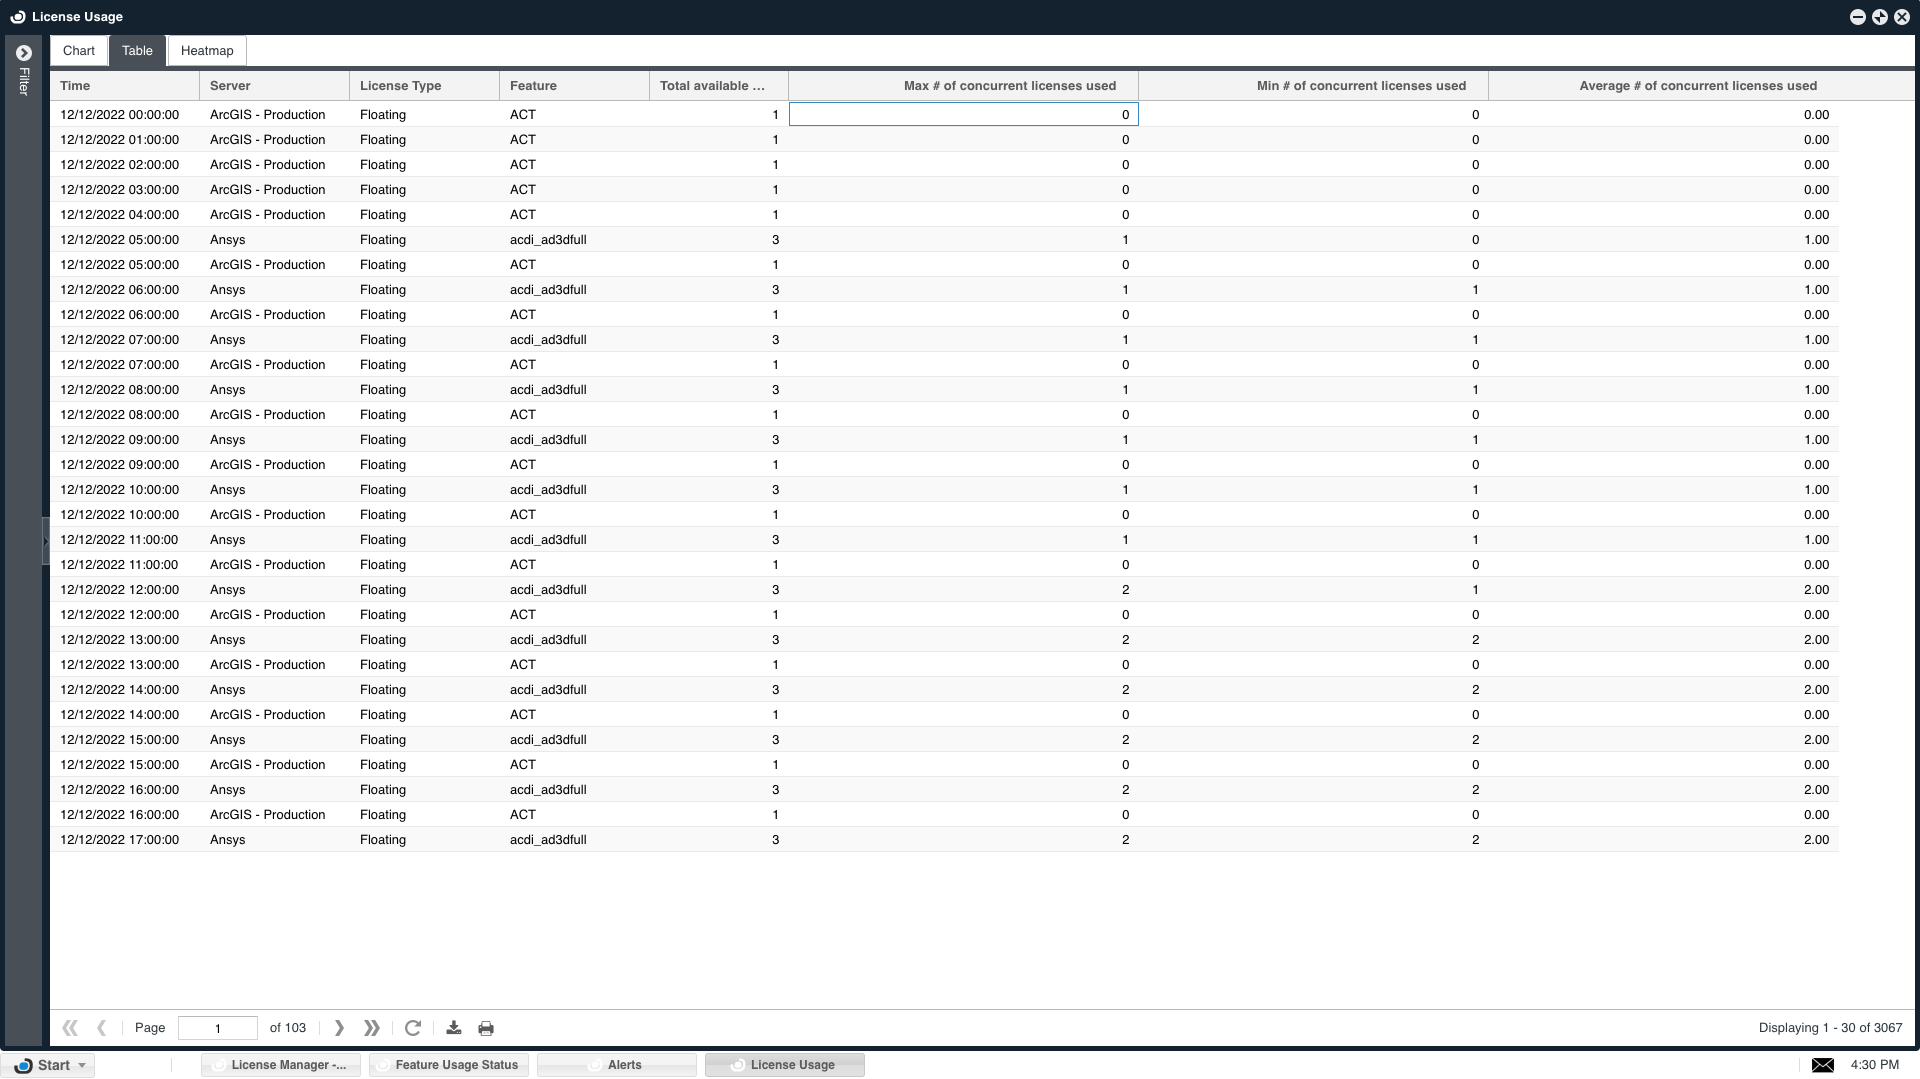
The "License usage" report window has some unique features:
- The chart view period can be zoomed in and out using the zoom drag buttons.
- The chart may be presented as "steps", "lines" or "Smoothed lines".
The license usage window's smart filter enables users to customize the usage report according to the following criteria: Server, Vendor, License Type, Additional Key (e.g. asset info), Feature, User, Group, and Project.
There are some unique features to the "License usage" window's filter:
- The period of the usage report is configurable: select between predefined periods (e.g. last 30 days) and a start-to-end period definition
- The "Aggregated usage" check box selects between displaying the maximal level ("top watermark") of usage sampled per period (hour /day/week) or the actual usage occurrences as reported by the license manager.
License Activity
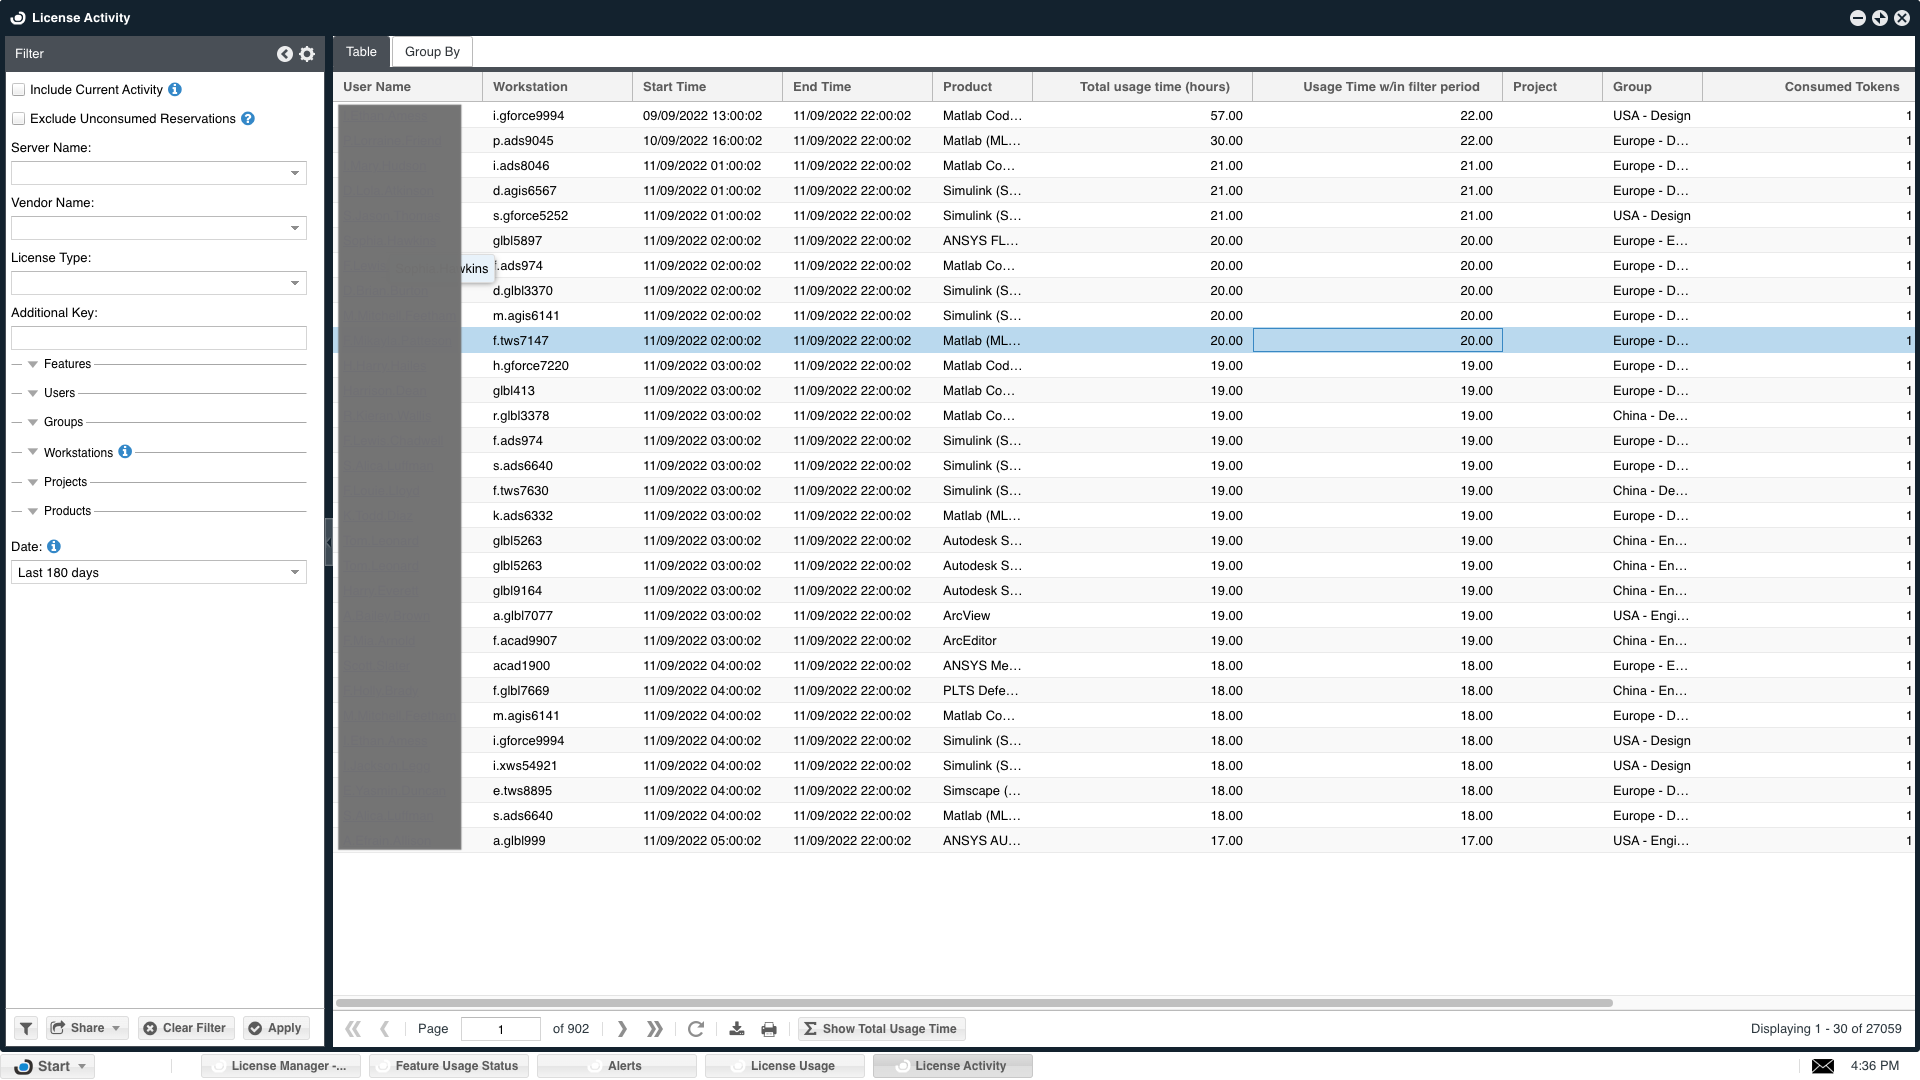
The License Activity window enables system administrators to produce sophisticated reports and track the license activity of individual users. The "Group by" tab on this window facilitates license statistics report generation according to Workstations, Features, Users, Groups, and Projects.
Projects and group usage
OpenLM facilitates the monitoring of user activity and can attribute license usage according to groups and projects. This functionality is often applied in order to implement a license chargeback policy (license usage billing).
Please refer to this document for more information on the different types of entities (e.g. Users, Groups, Projects) in OpenLM.
Project usage report
Project reporting enables project-oriented companies to get license usage time according to the active project, as reported by the end user.
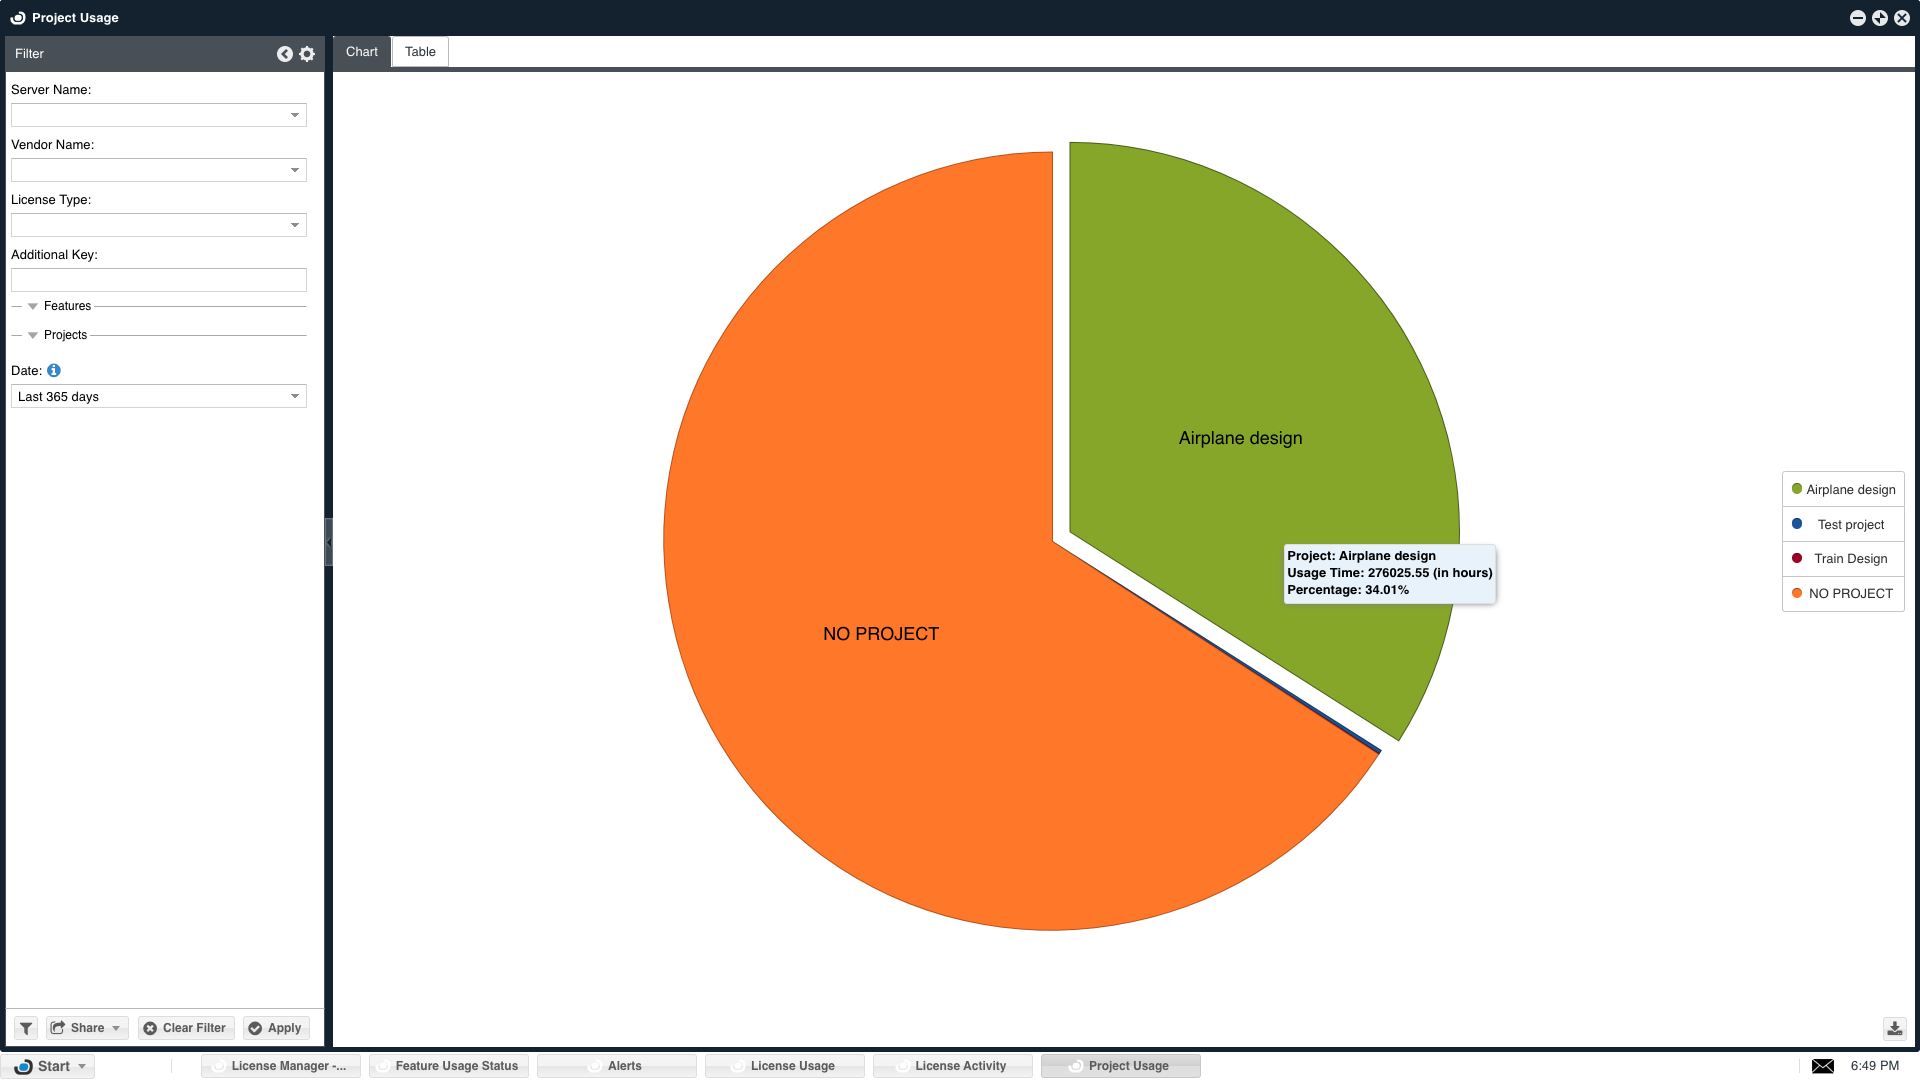
For more information on license usage reporting by projects, please refer to this document.
Group usage report
Group reporting allows managers and system administrators to obtain license usage statistics according to groups.
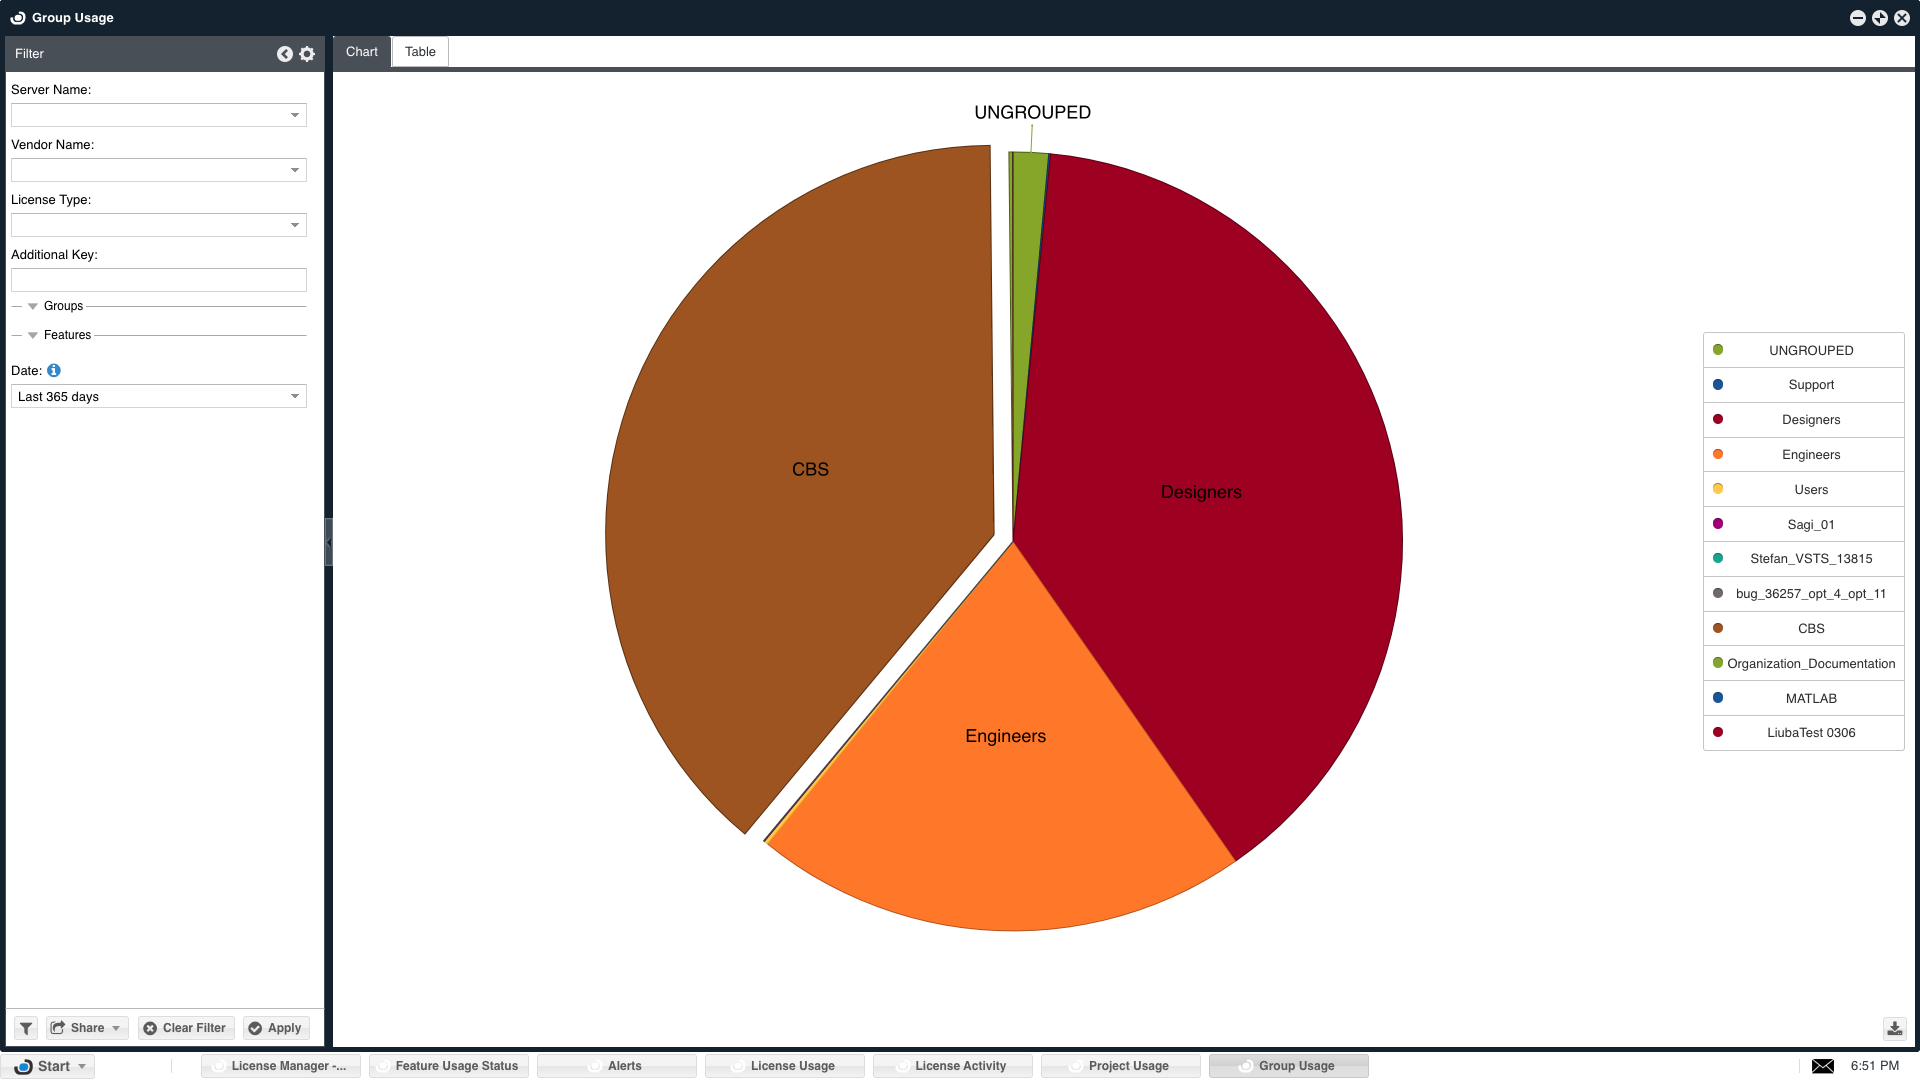
License utilization ("Efficiency report")
Click the EasyAdmin 'Start' button, and select 'Management' → "License utilization".
This chart indicates the license usage efficiency. Each column 'x' answers the question: "What is the percentage of usage time that at least x licenses have been in use". This form of presentation ignores momentary usage peaks and provides a vivid realization of the true license consumption pattern. It depicts the number of licenses that are required in the organization.
The QoS line indicates the number of required licenses to support a certain percentage of license requests. In the example below, the chart shows that only 7 licenses (out of 12 available licenses) are required to support 96% of license requests:
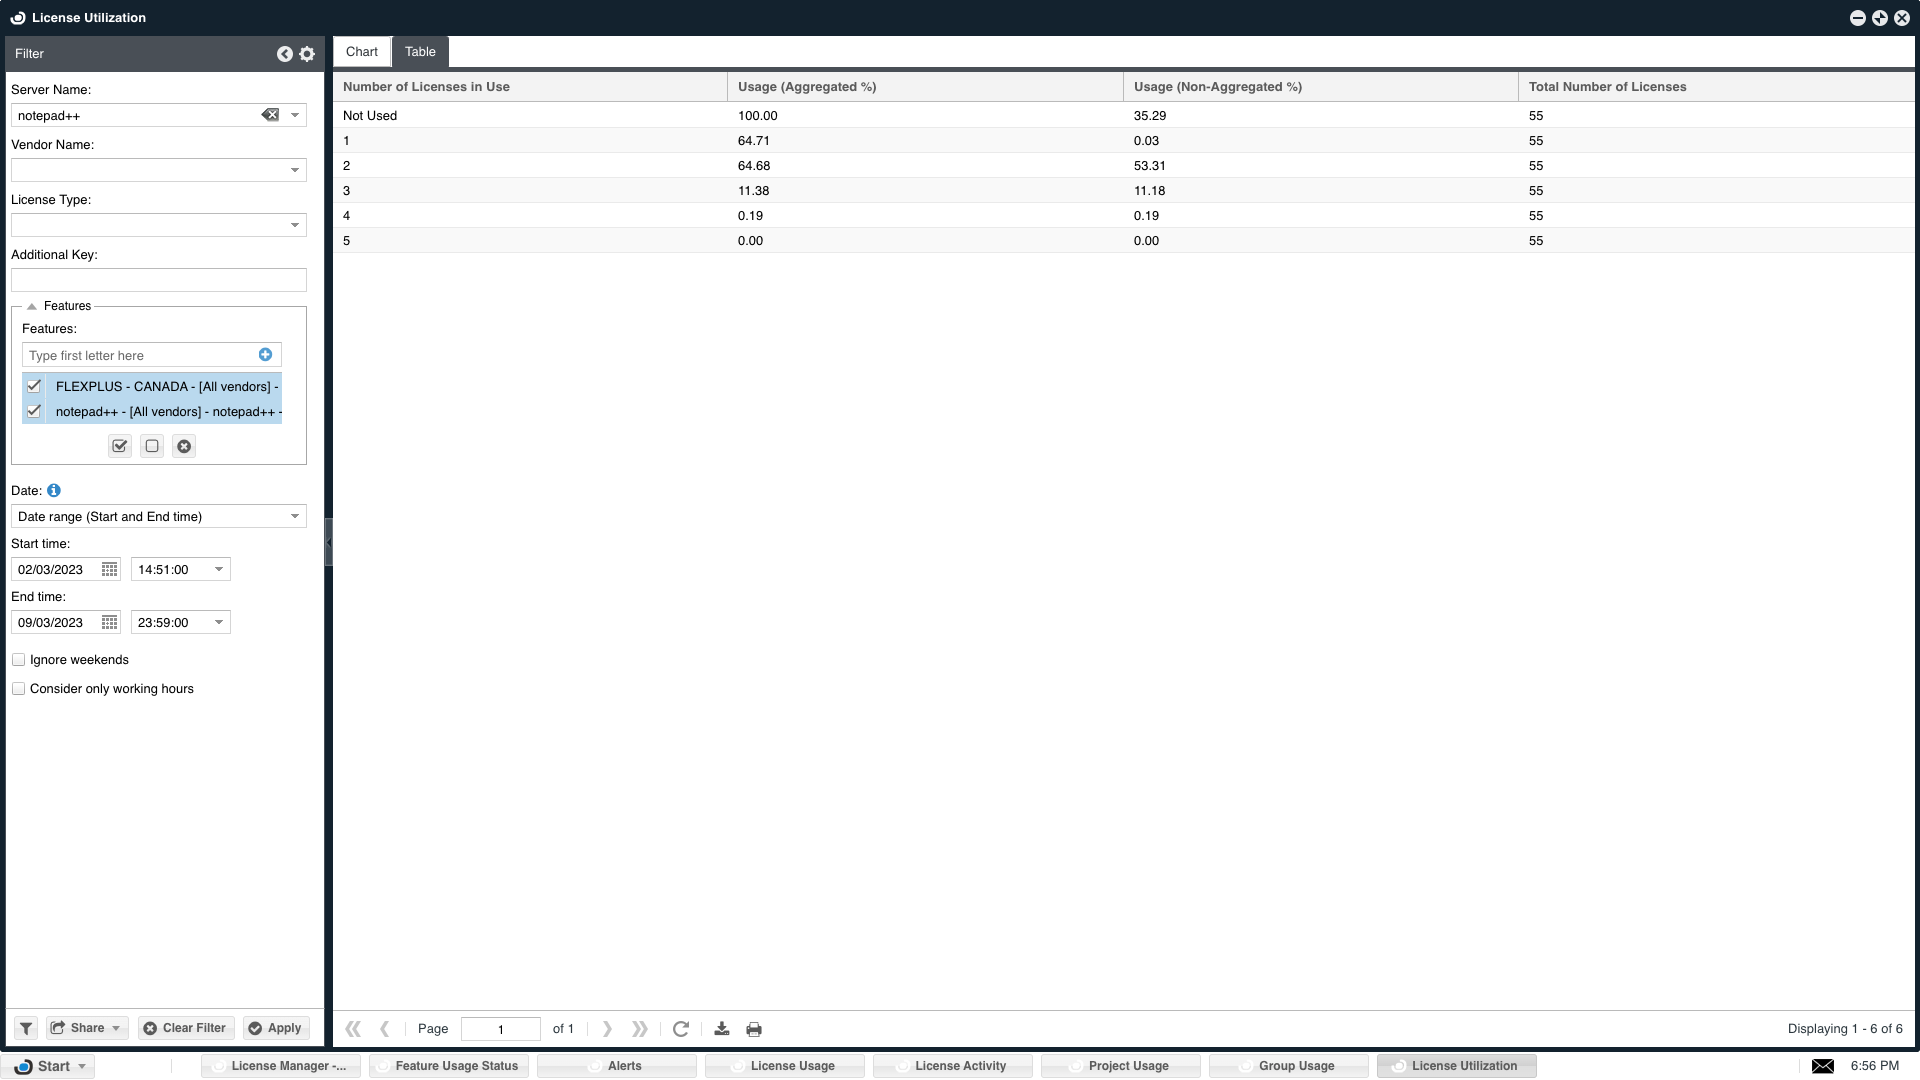
For more information about this important report window, please refer to this document.
Additional license usage reports
Click the EasyAdmin 'Start' button, and select 'Reports' → "Feature usage per group". This window presents the usage in hours of selected features per the selected user groups or all active groups, in a stacked vertical bar chart. Hover over the chart to view explicit usage information per each section of the bars.
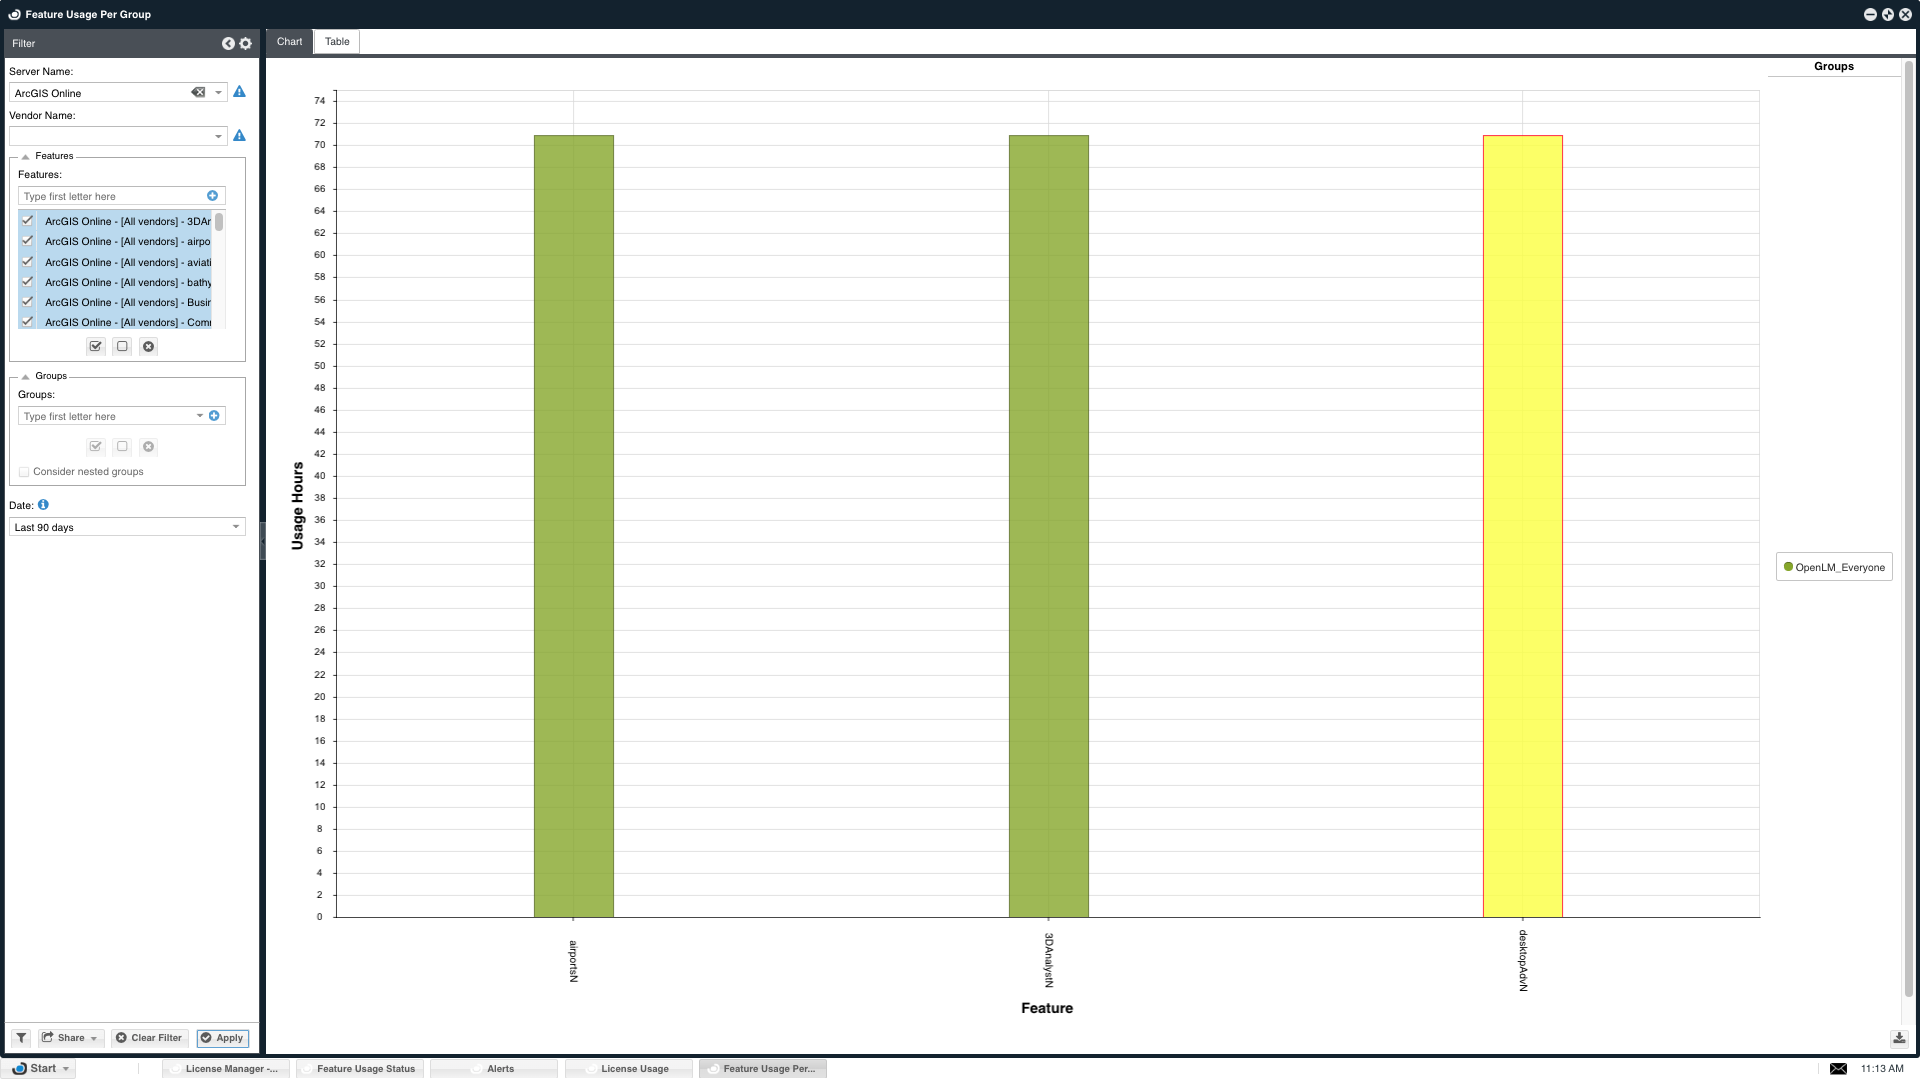
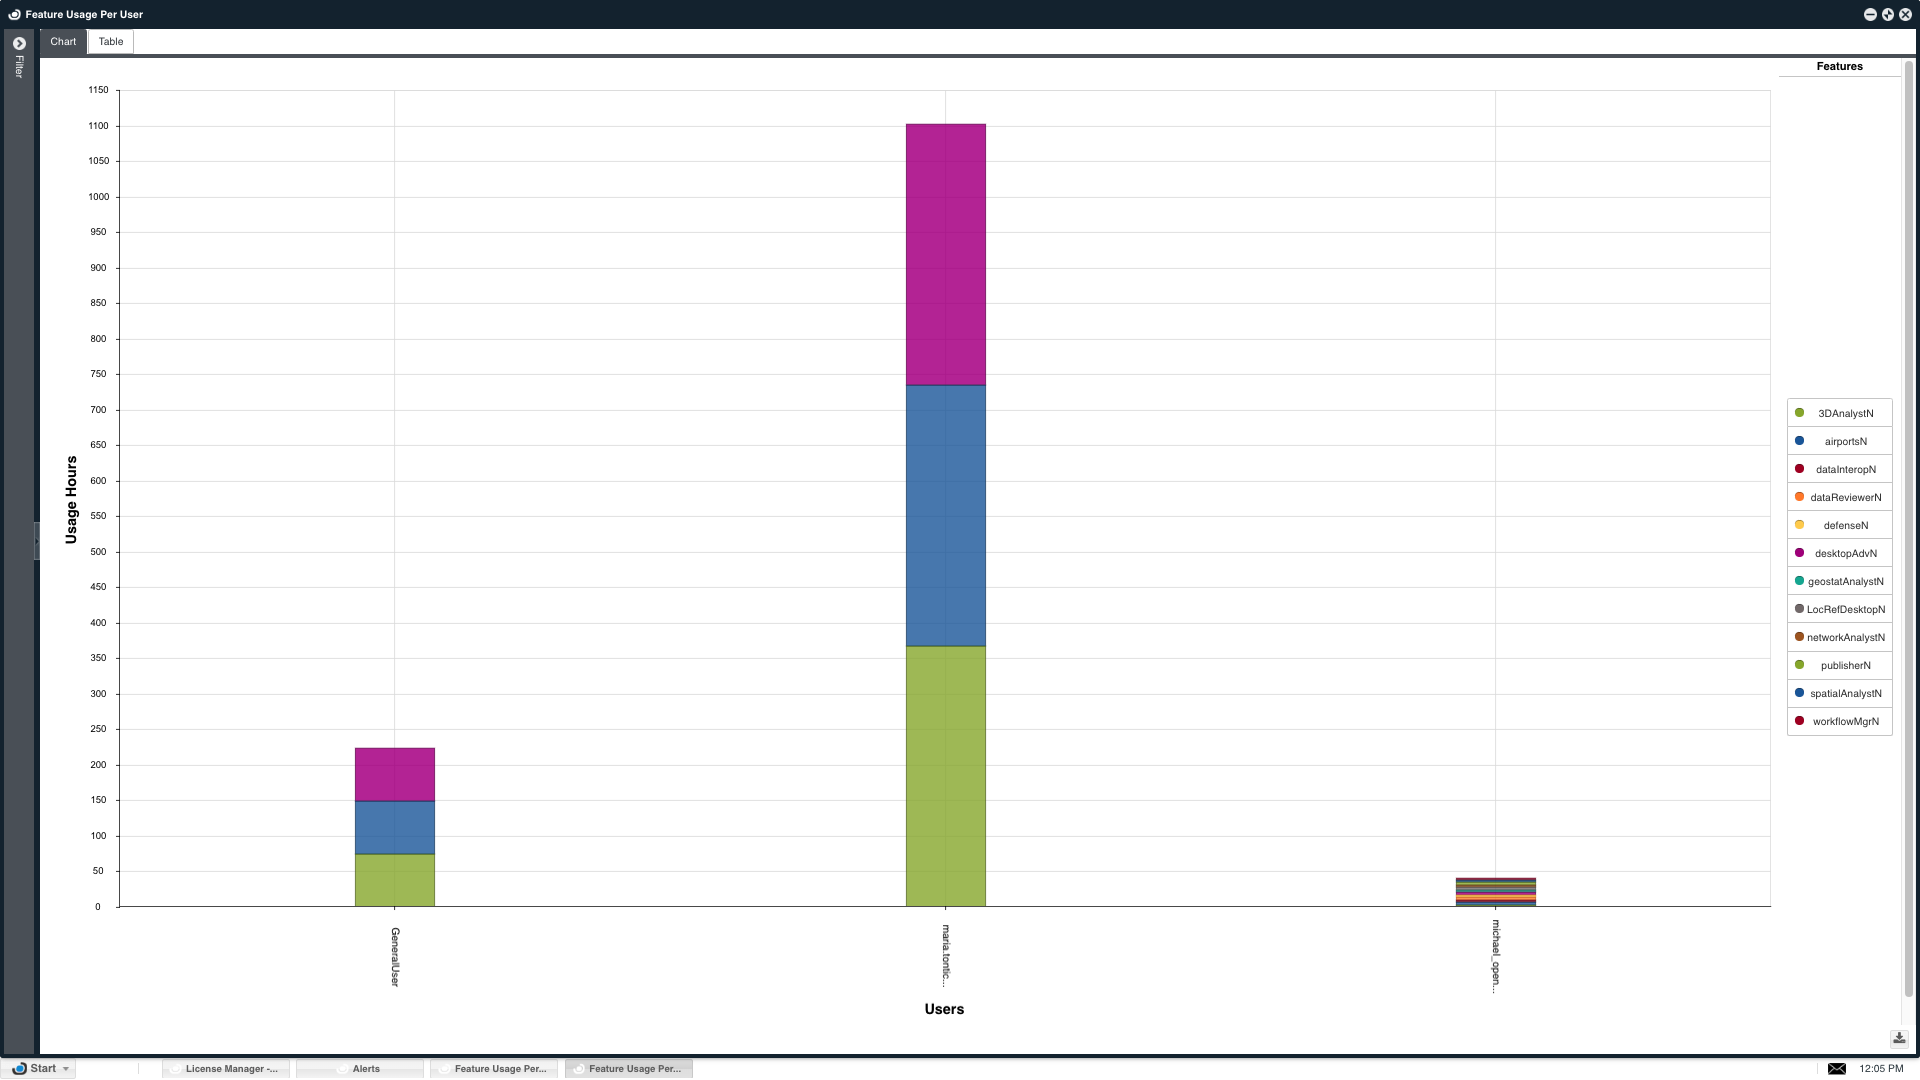
Click the EasyAdmin 'Start' button, and select 'Reports' → "Feature usage per user". This window presents the usage in hours of selected features per the selected users or per all active users, in a stacked vertical bar chart. Hover over the chart to view explicit usage information per each section of the bars.
Denied license requests
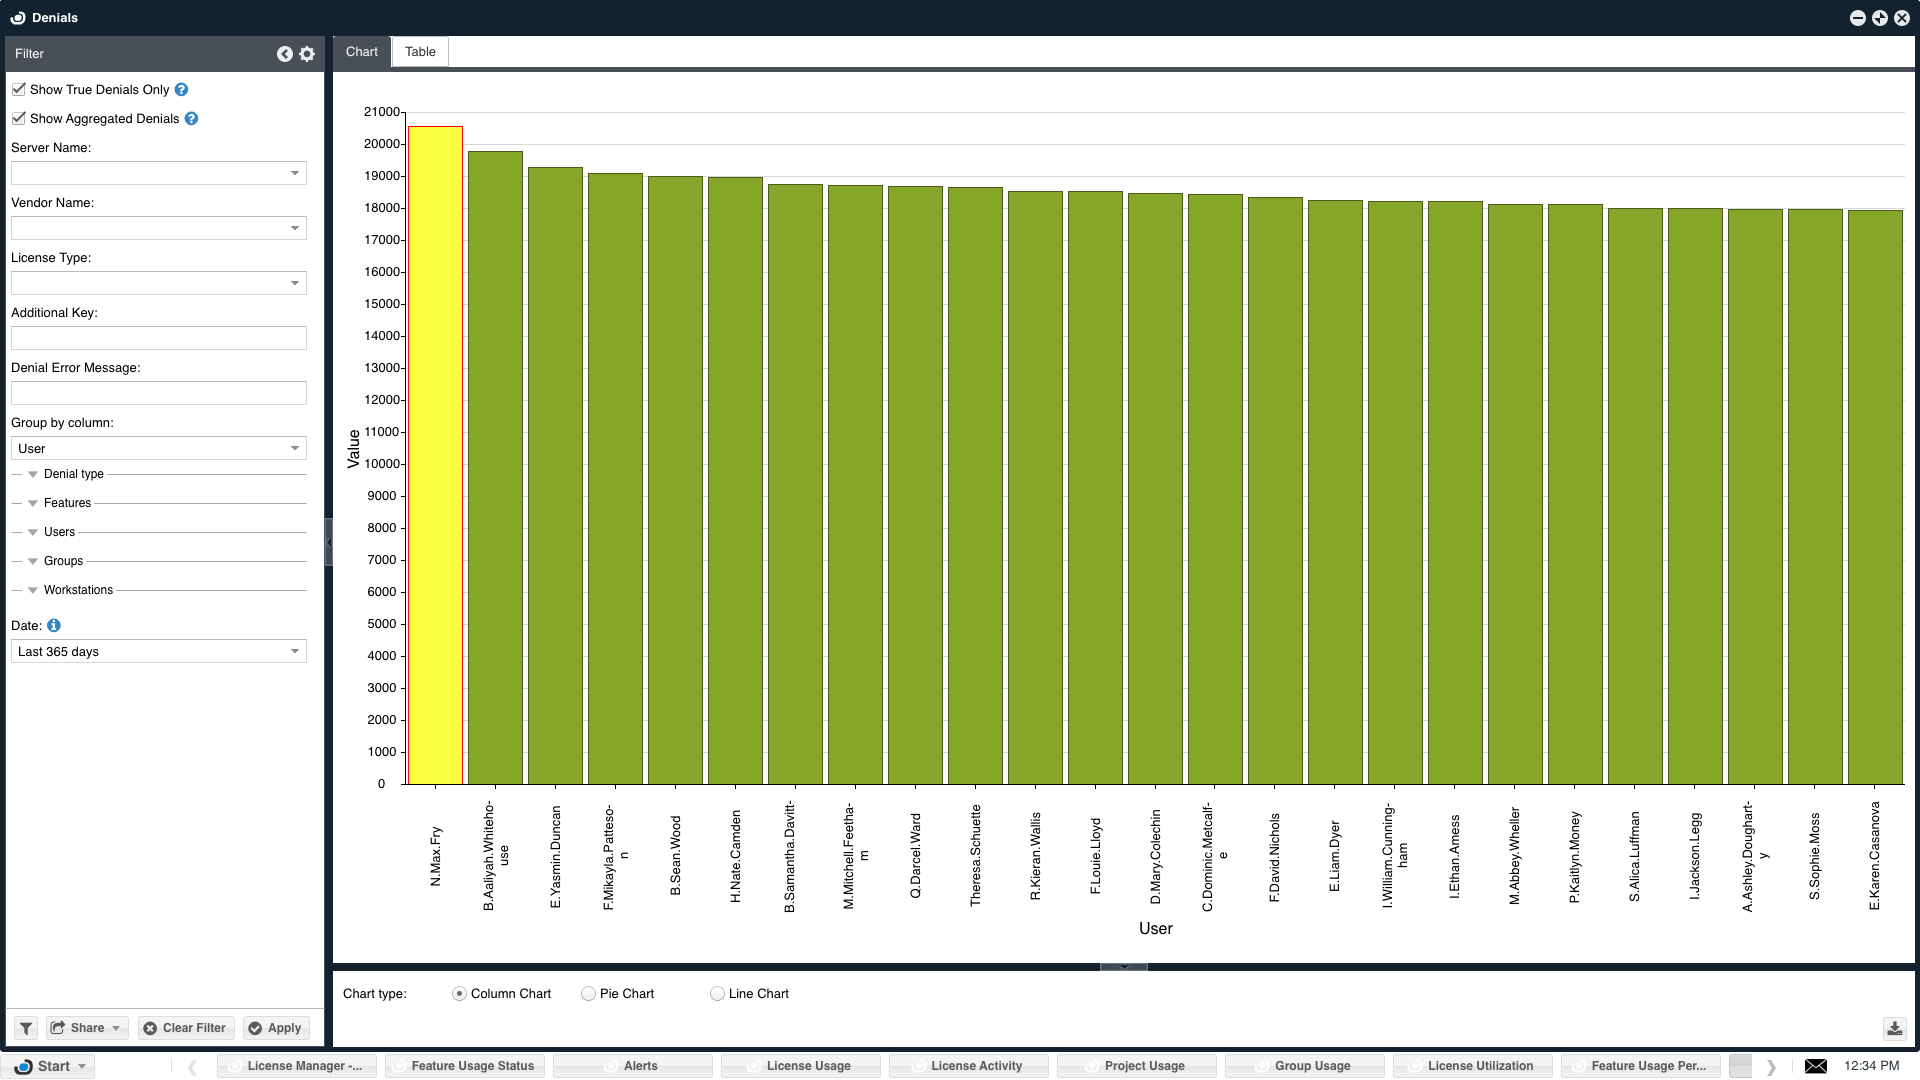
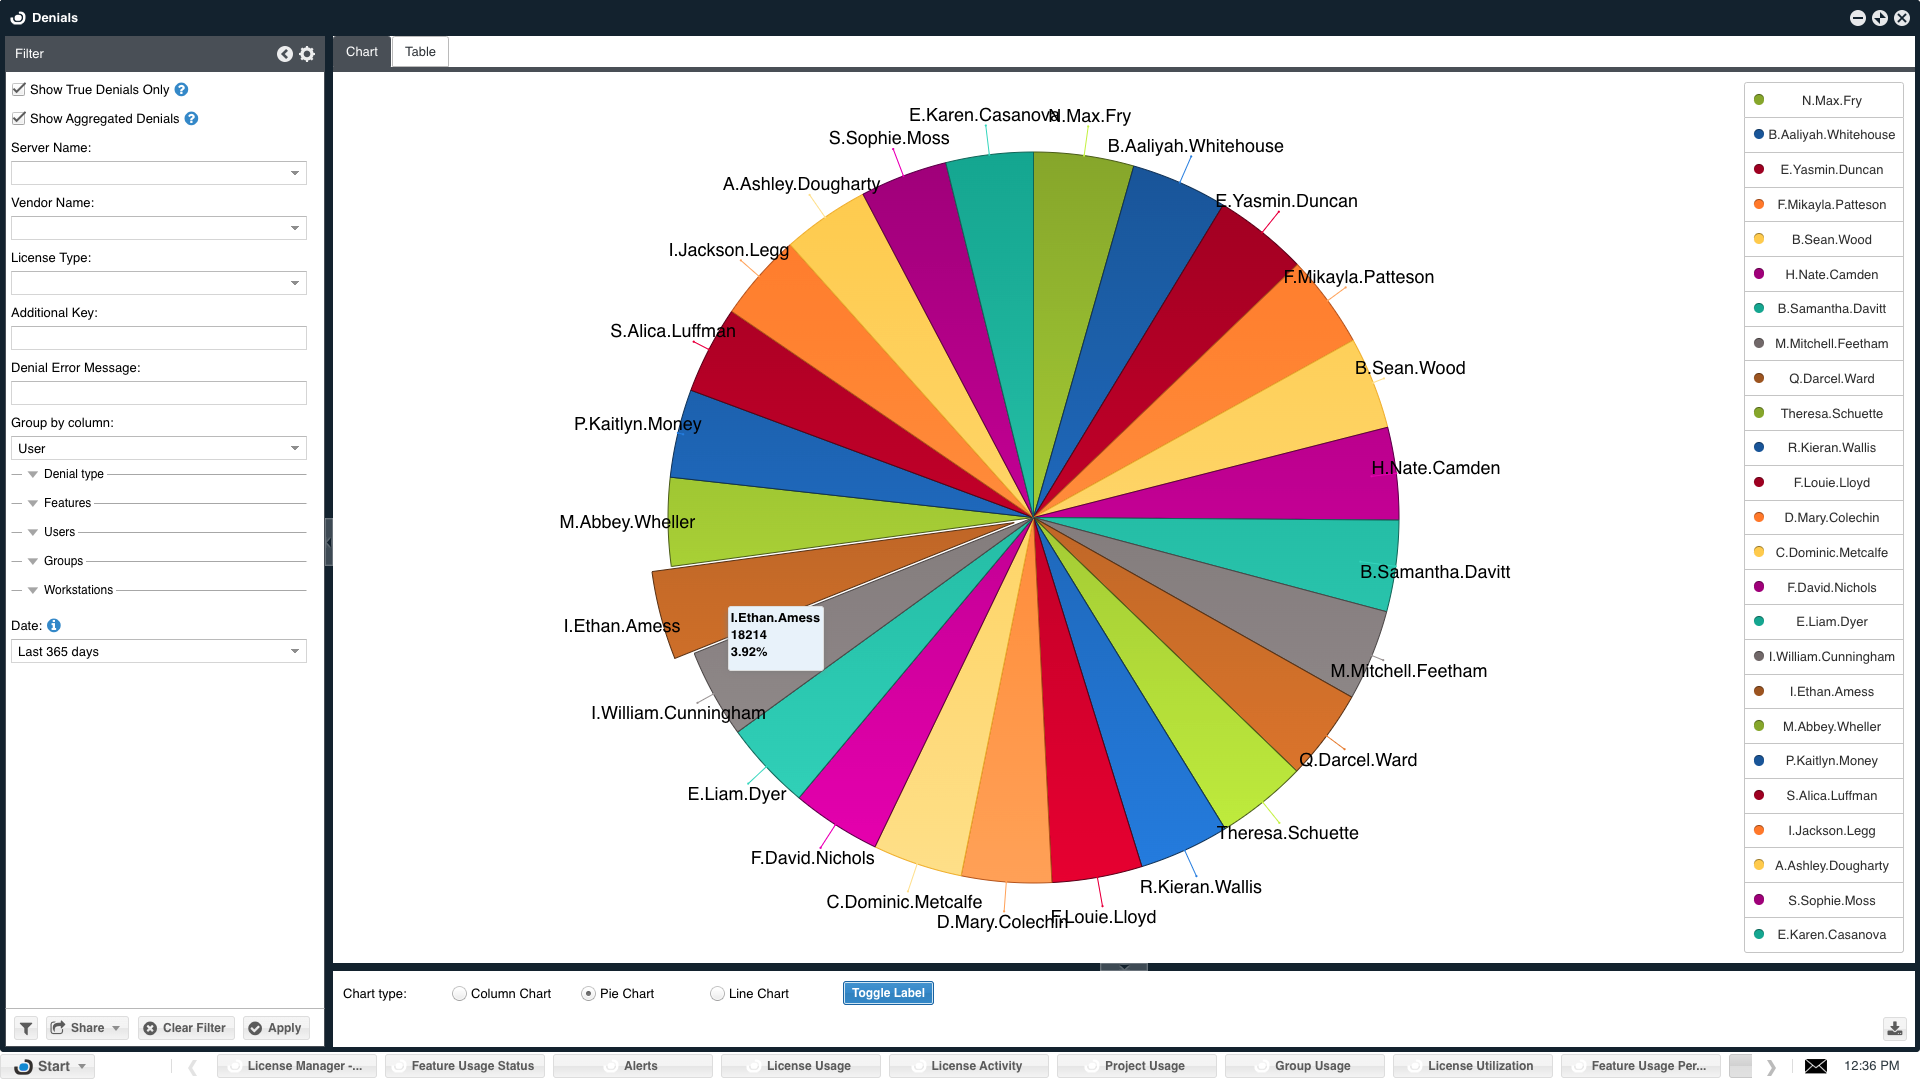
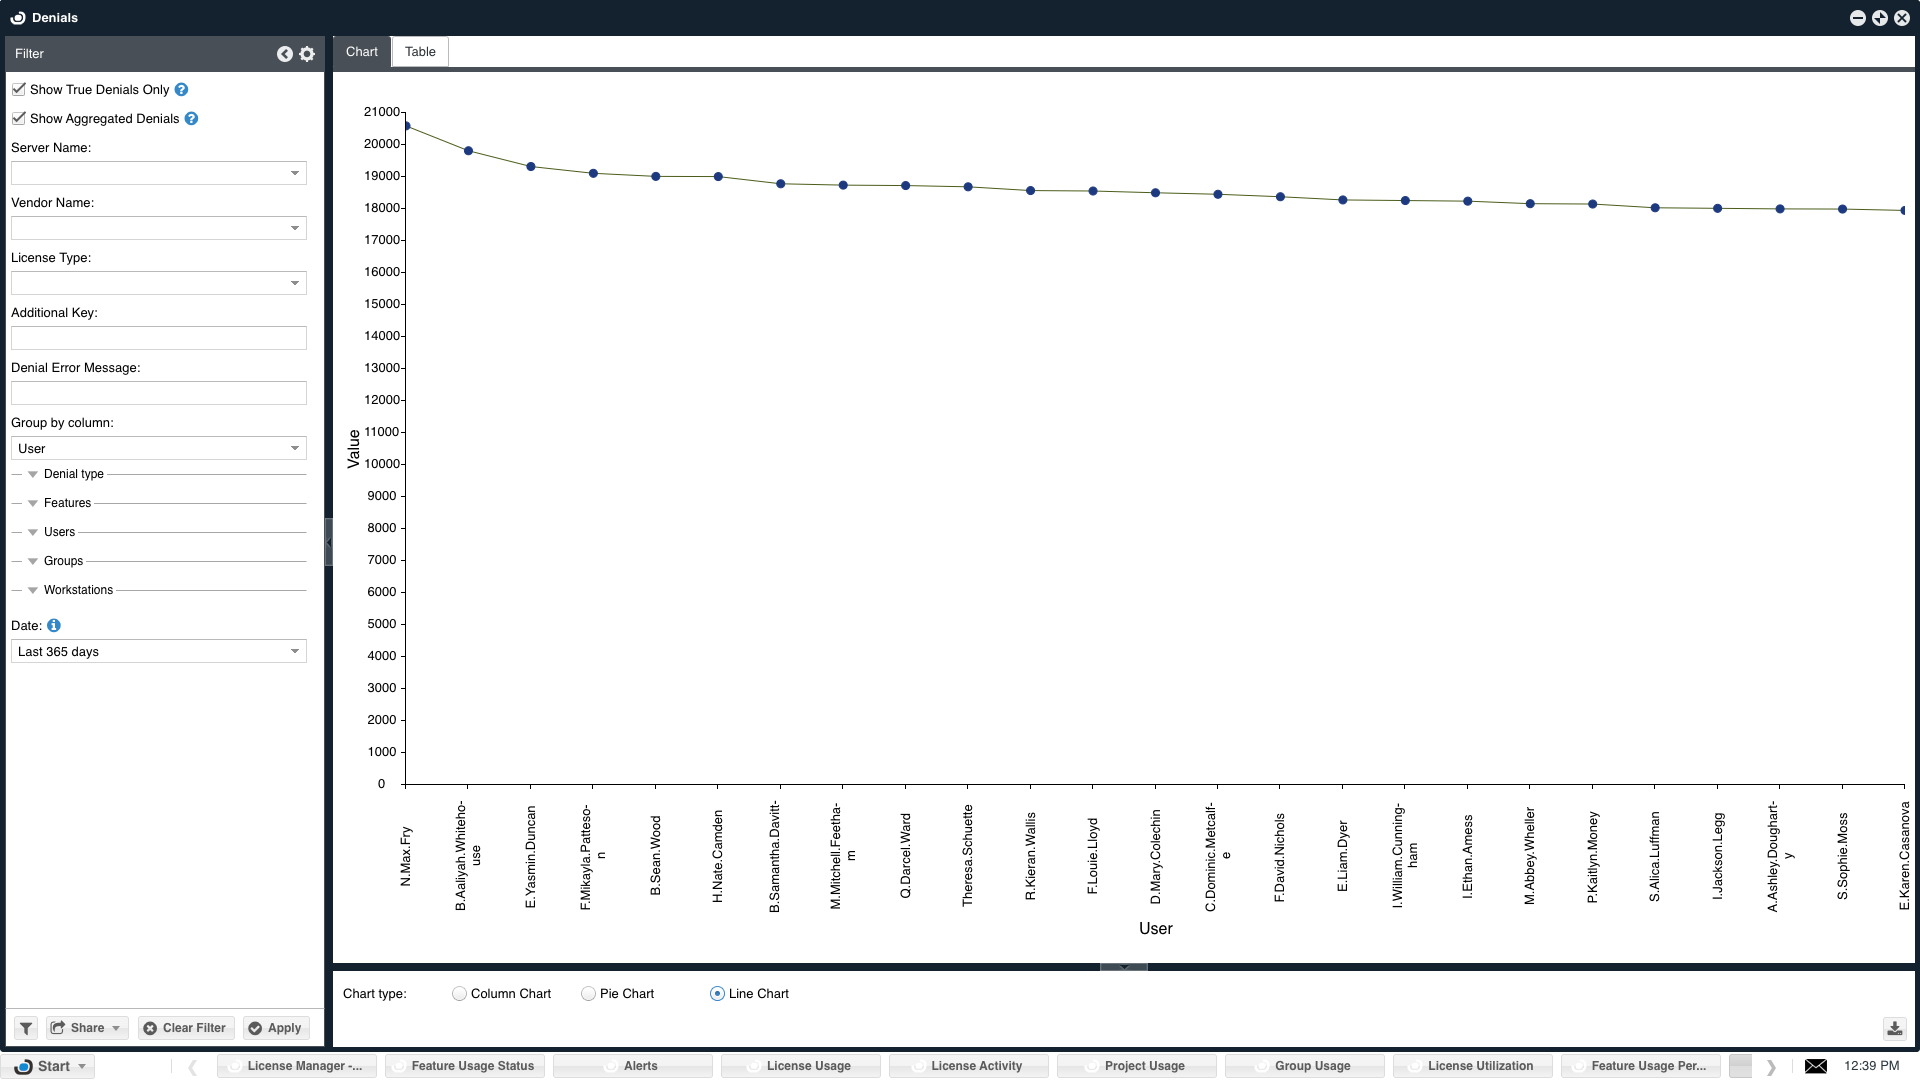
Click the EasyAdmin 'Start' button, and select 'Reports' → 'Denials'.
This is a presentation of historic license denial occurrences.
To see the list of the License Managers OpenLM supports the reporting of denials for, please see this document
This feature requires the installation of an OpenLM Broker on the license server machine. Please consult this document for more information.
A few points to note regarding the Denials report window:
- Information may be sliced according to a list of criteria, e.g.: time, user, project, group, workstation, denial type, vendor name, license server, license type (e.g. Floating, Node-locked), and "additional key" (e.g. FlexLM asset info), Denial Type ( License Server Error, Limit Reached, Problem With License, Restriction Or Authorization, Unspecified Reason, Other).
- It may be presented as a pie chart, line, or table.
- The filter includes a "True denials" check box. This option filters out irrelevant denial reports made by the license manager. Such irrelevant reports include:
- Multiple requests are made by a specific user in a short period.
- License requests that have been denied by one server, but granted by another.
- The filter includes the "Aggregated Denials" checkbox. This option aggregates the denials in a predefined period. When a user tries to get a license every few seconds, this would mean many true denials in a time stamp. For example, if a user tried to get a license 5 times in one minute, and failed, those 5 denials are collected as 5 True Denials. But, if the "Aggregated Denials" box is checked, this will be displayed as a single denial.
OpenLM EasyAdmin User Interface - Widgets - Recent features denials
Click the EasyAdmin 'Start' button, and select 'Widgets' → "Recent feature denials". This window provides preliminary statistical processing of license denials per feature: It presents the number of denied license requests in a long-term and short-term period.
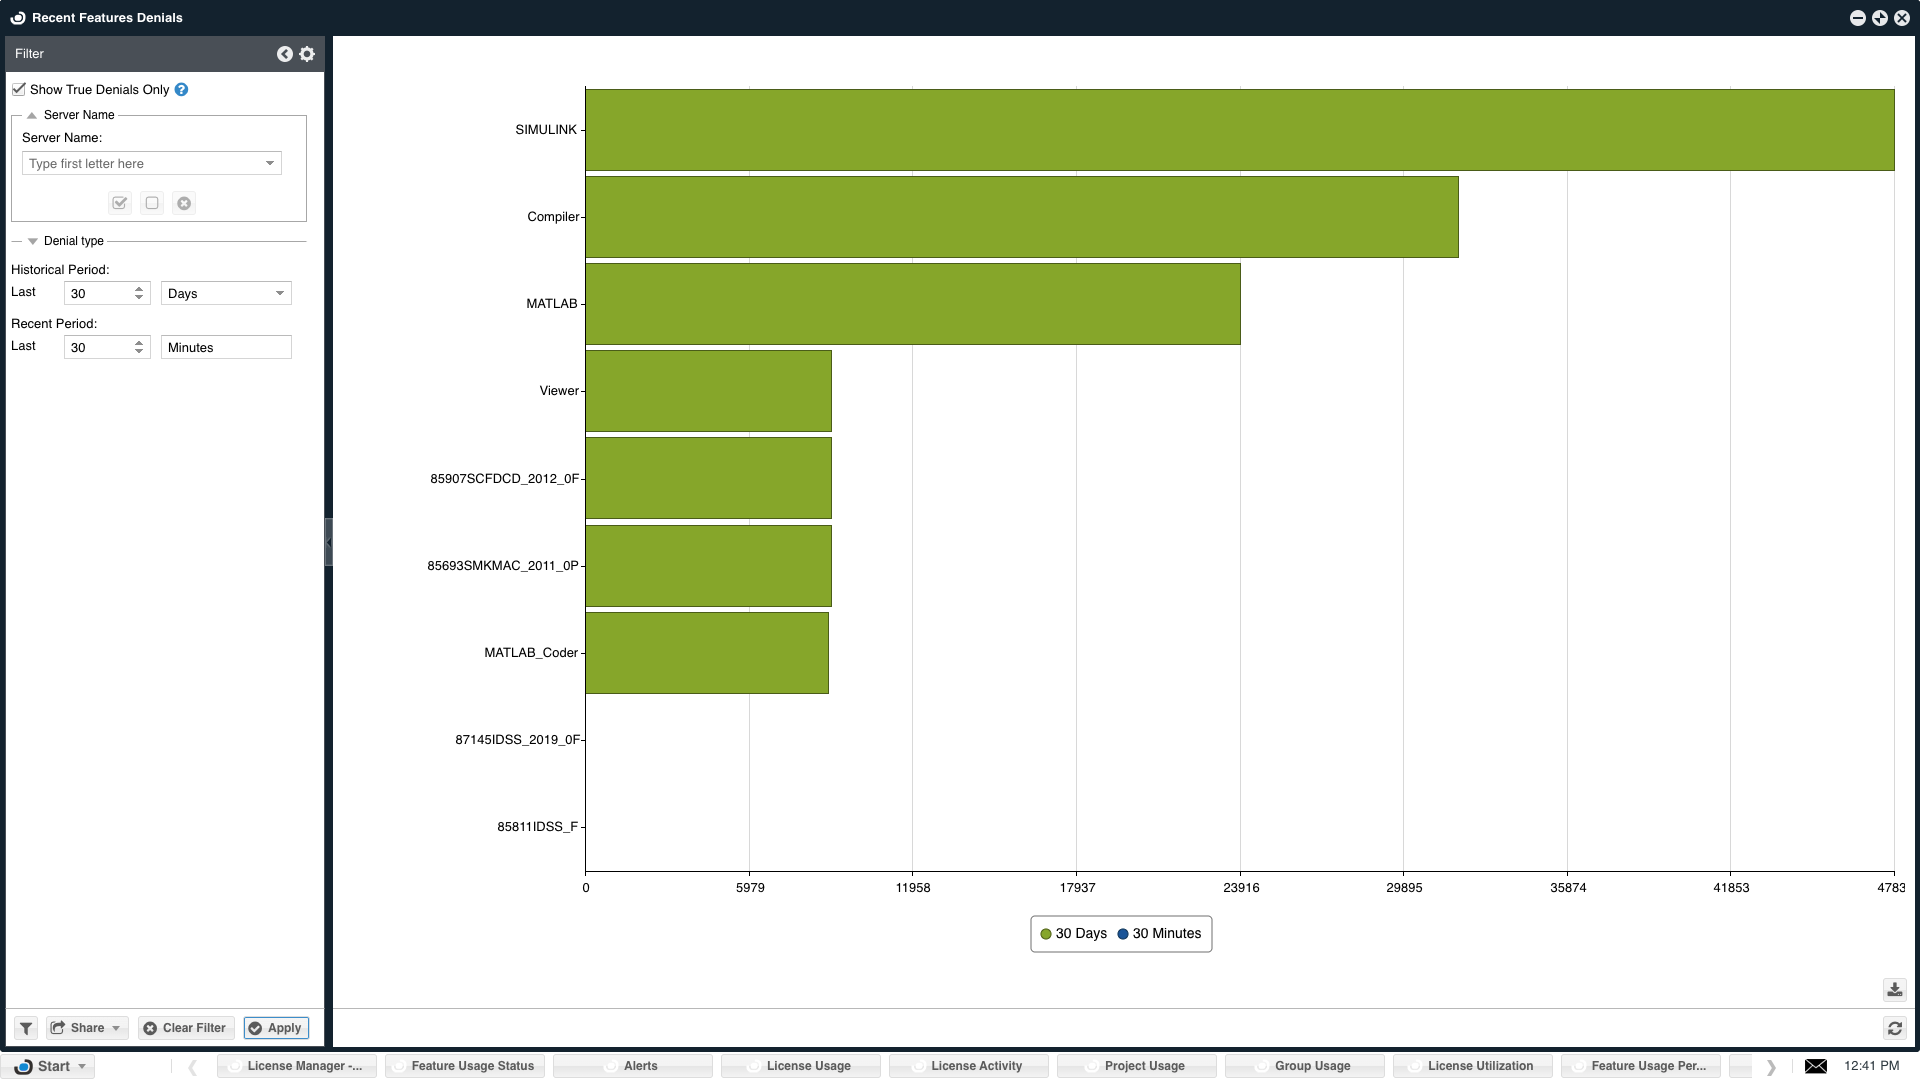
Recent Features Denials
There's more!
In addition to the various historical license reports depicted above, OpenLM provides a configurable platform to prepare customized license reports. Please read more about them here.
Please feel free to turn to our support team (support@openlm.com) with any issue or request concerning the reporting of license usage on the OpenLM system.