Report summary
Report Summary is a high-level dashboard that displays the current status of license servers, compares total license usage time versus idle time (hours), and lists the top 10 most and least active users based on software usage duration, using the latest available data.
 Report Summary
This report provides an overall summary for the entire dashboard.
Visualizations
-
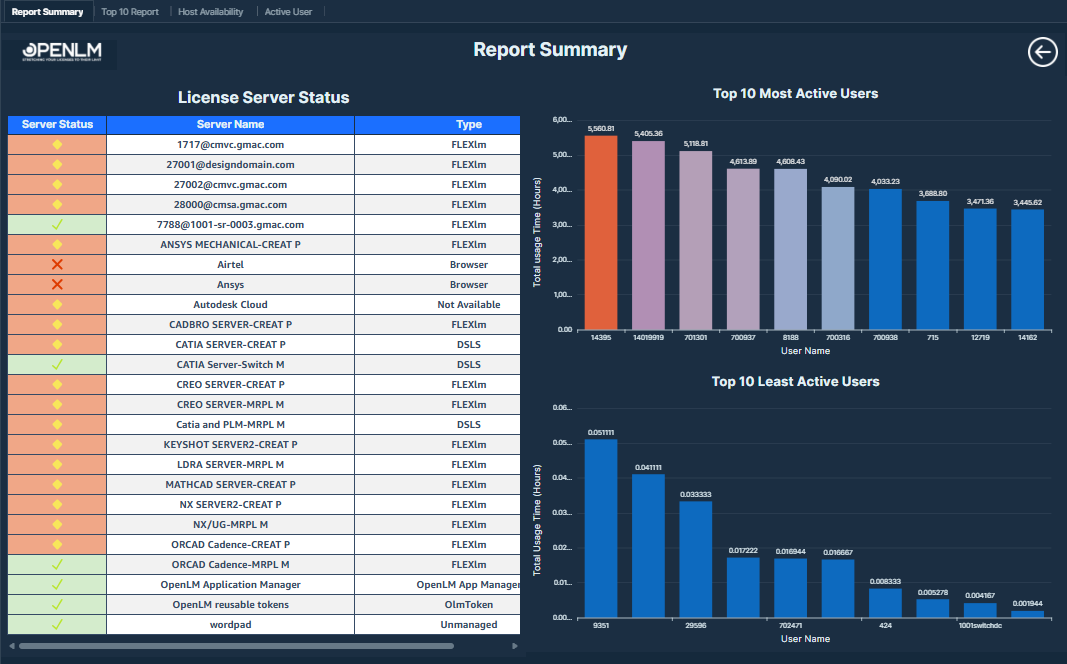
License Server Status table: This table includes 3 fields: server status, server name, and type. Server status shows the real time status of the server when the user refreshes the database. Status values use color cues: green for Up (UP), red for Down (DOWN), and yellow for Data Error (DATA_ERROR), No Valid Lic File (NO_VALID_LIC_FILE), or Unknown (UNKNOWN).
-
Total Usage versus Total Idle Time (Hours): This visual compares the total usage time and total idle time aggregated across users, displayed in hours.
Values displayed:
-
Total Usage Time (Hours): The amount of time within the session duration when the license was actively used by the user. Calculate this value by subtracting the session start time from the end time. The difference is measured in seconds and then divided by 3600 to convert it into hours.
-
Total Idle Time (Hours): The portion of the session during which the license remained unused or inactive. The calculation checks if the Idle Time is NULL, and if so, returns 0. Otherwise, it divides the Idle Time in minutes by 60 to convert it into hours, ensuring that sessions with missing idle time are still counted.
-
Top 10 Most Active Users: This visual depicts the top 10 active users by Total usage time (hours).
-
Top 10 Least Active Users: This visual depicts the bottom 10 active users by Total usage time (hours).