License usage
A report that displays the percentage of licenses used concurrently over time, along with detailed breakdowns of concurrent usage per feature. It helps monitor peak demand and identify heavily used license features.
 License Usage
This table displays the feature-wise maximum concurrent license usage and the percentage of total available licenses, with drilldown capability to assess license utilization efficiency.
Visualizations
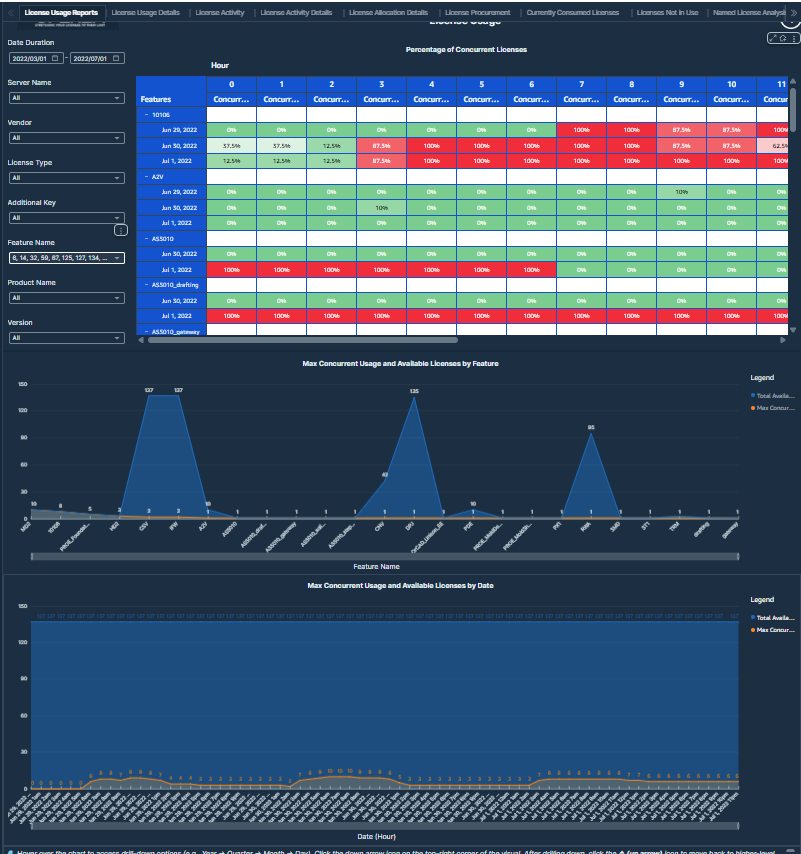
- Percentage of Concurrent Licenses Used from Total Available Licenses Heatmap: This visual shows the concurrent license usage as a percentage of total number of licenses available for each feature across every hour of a day belonging to different usage dates. This matrix helps identify peak load times and periods of underutilization.
Values displayed:
- Feature names
- Hour columns: Represents each hour of the day (0-23).
- Date Rows: Represents different usage dates.
- Concurrent Usage Percentage Cells: The concurrent usage percentage shows how much of the total available licenses users consumed during that hour for a given feature and usage date. Calculate the percentage by dividing the maximum concurrent usage by the total number of licenses available and then multiplying by 100.
![]() License Usage view 2
License Usage view 2
-
100% usage appears in solid red, indicating complete license consumption with no available capacity remaining.
-
75% to less than 100% usage appears as a dark red to bright red gradient, signaling high license usage nearing saturation.
-
50% to 75% usage appears in light red or pink, showing moderate to high utilization with limited buffer capacity.
-
12.5% to 50% usage appears in light green to pale green, indicating low to moderate license usage.
-
0% usage appears in bright green, representing idle periods with no active license consumption.
-
Concurrent Usage and Available Licenses by feature: This area chart compares the total quantity of licenses and maximum concurrent usage for each feature. The X-axis lists the feature names and the Y-axis shows license quantities and maximum concurrent usage counts. The chart allows comparison between license availability and actual usage, highlighting underutilization. Users can drill down to compare these metrics across years, quarters, months, days, and hours for deeper analysis.
Values displayed:
-
Feature Names: Highest level of category.
-
Time: Drilldown categories.
-
Max Concurrent Usage
-
Quantity
-
Filters:
-
Date Duration: Users can select any date range within a rolling 10-year window - from January 1, 2015 to July 17, 2025 - using this filter.
-
Server Name: Users can select any server name from this filter.
-
Vendor: Users can select any vendor from this filter.
-
License Type: Users can select any license type from this filter.
-
Additional Key: Users can select any additional key from this filter.
-
Feature Name: Users can select any feature name from this filter.
-
Product Name: Users can select any product name from this filter.
-
Version: Users can select any version from this filter.
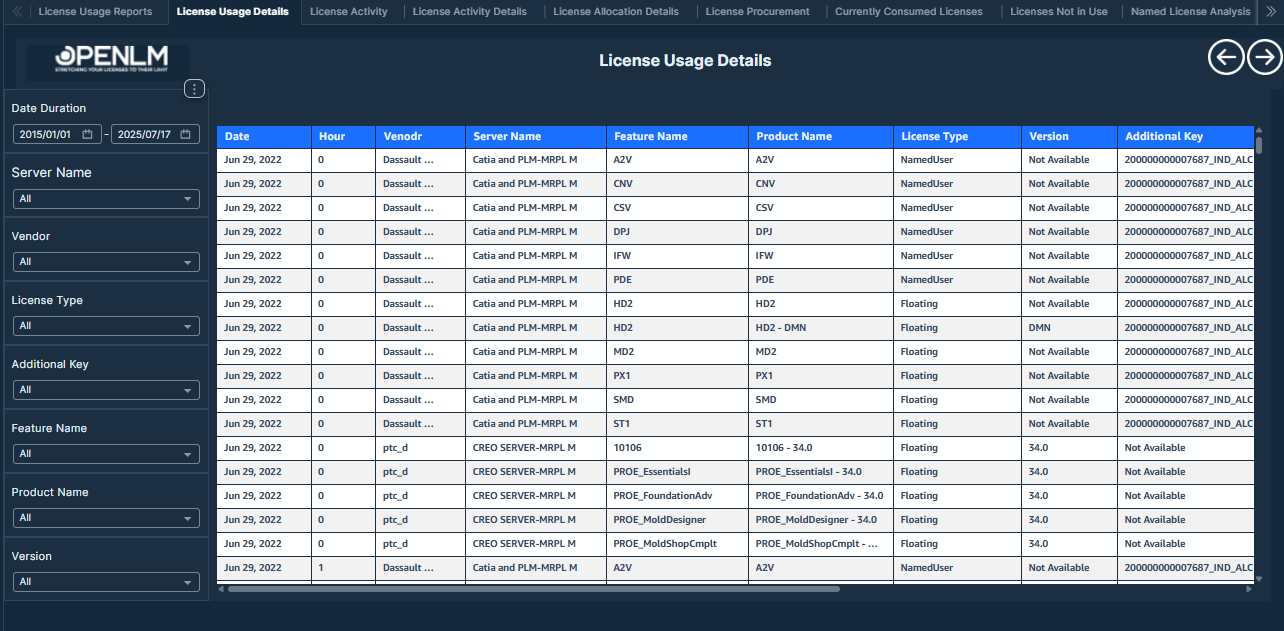
License Usage Details
This report provides a tabular view of concurrent license usage for a specific feature, offering detailed insights into how much of the available licenses users actively consume in each hour.
 License Usage Details
Use this report to review the table-formatted concurrent usage overview of a particular feature from the License Usage report.
Visualizations
- License Usage Details Table: The License Usage Details Table provides a detailed, timestamped view of license usage activity. For the selected time range, it captures 3 key concurrent usage metrics: Minimum Concurrent Usage, the lowest number of licenses a feature uses simultaneously, indicating the lightest system load; Maximum Concurrent Usage, the highest number of licenses a feature uses simultaneously, reflecting peak demand; and Average Concurrent Usage, the average number of licenses a feature uses simultaneously, which helps describe typical system behavior.
Values displayed:
-
Date: Usage Date.
-
Hour: Usage Hour.
-
Vendor: Respective license vendor.
-
Server Name
-
Feature Name
-
Product Name
-
License Type: Specifies the type of license based on the usage scope (for example, Floating, Named User, or Node Locked).
-
Version: Indicates the version of the software feature accessed.
-
Additional Key
-
Total Available Licenses
-
Max Concurrent Usage
-
Min Concurrent Usage
-
Average Concurrent Usage
-
Filters:
-
Date Duration: Users can select any date range within a rolling 10-year window - from January 1, 2015 to July 17, 2025 - using this filter.
-
Server Name: Users can select any server name from this filter.
-
Vendor: Users can select any vendor from this filter.
-
License Type: Users can select any license type from this filter.
-
Additional Key: Users can select any additional key from this filter.
-
Feature Name: Users can select any feature name from this filter.
-
Product Name: Users can select any product name from this filter.
-
Version: Users can select any version from this filter.