License utilization
The License Utilization report provides a detailed analysis of how effectively licenses are being used across different features. It focuses on actual consumption patterns by showing the relationship between the number of licenses in use and their corresponding utilization percentage. This report helps identify underutilized or overutilized licenses, enabling better monitoring and optimization of license usage.
 License Utilization
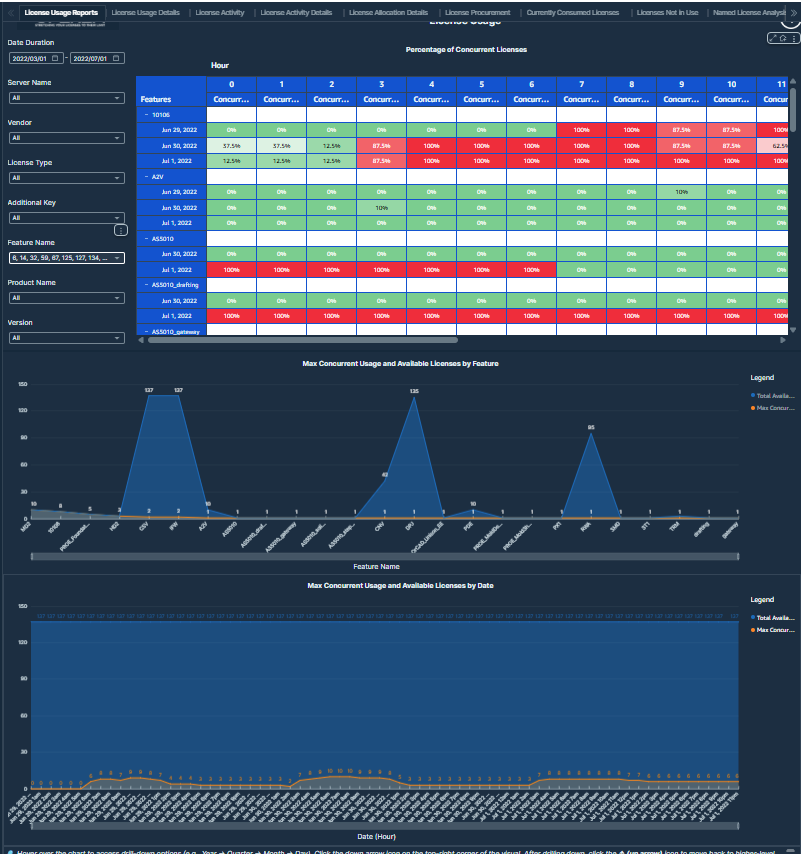
License Utilization report showing required versus purchased licenses to ensure service quality and optimize license procurement.
Visualizations
-
License Utilization Curve: A line chart that represents the relationship between the number of used licenses and the corresponding usage percentage across features.
-
KPI Card (Total Licenses): Displays the total number of available licenses in the system.
Values displayed:
-
Number of Used Licenses: Represents the count of licenses actively in use at a given point.
-
Usage Percentage: Indicates the percentage of total licenses being used.
-
Feature Name: Identifies the software feature associated with the usage curve.
-
Total Licenses: Displays the total available license pool for reference.
-
Filters:
-
Date Duration: Users can select a time range to analyze license utilization trends over a specific period.
-
Feature Name: Users can select any feature name from this filter.
-
Additional Key: Users can select any additional key from this filter.
-
License Type: Users can select any license type from this filter.